Testing SuperCatch with your club? Start here
SuperCatch
Sea temperature

This hour's water, and the whole picture behind it.

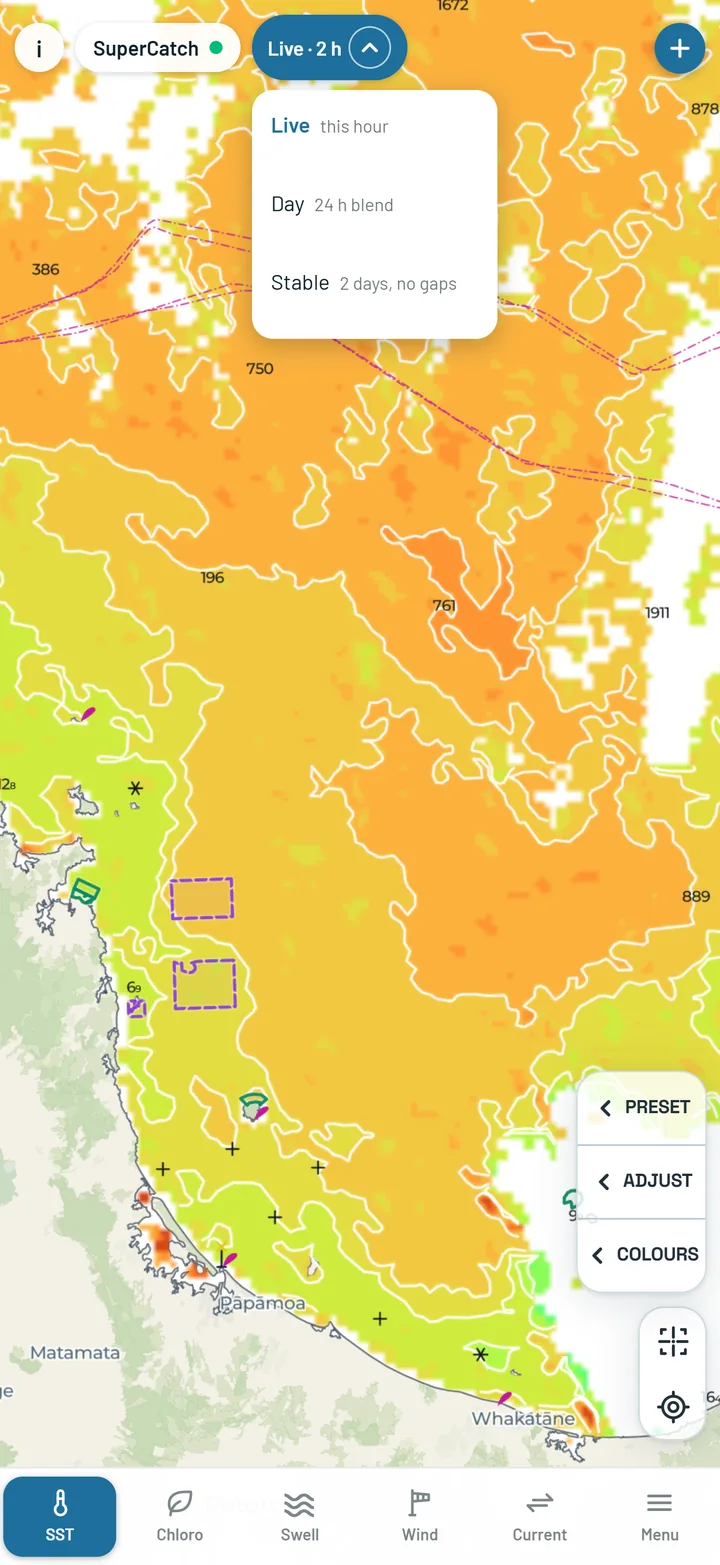
Tap SST on the bottom strip. Three versions sit behind it - Live, Day and Stable - and the mode pill in the top bar always says which one is on screen.

SST Live - this hour

Himawari-9 via JAXA P-Tree · ~2 km · a new picture every hour, day and night

What you see

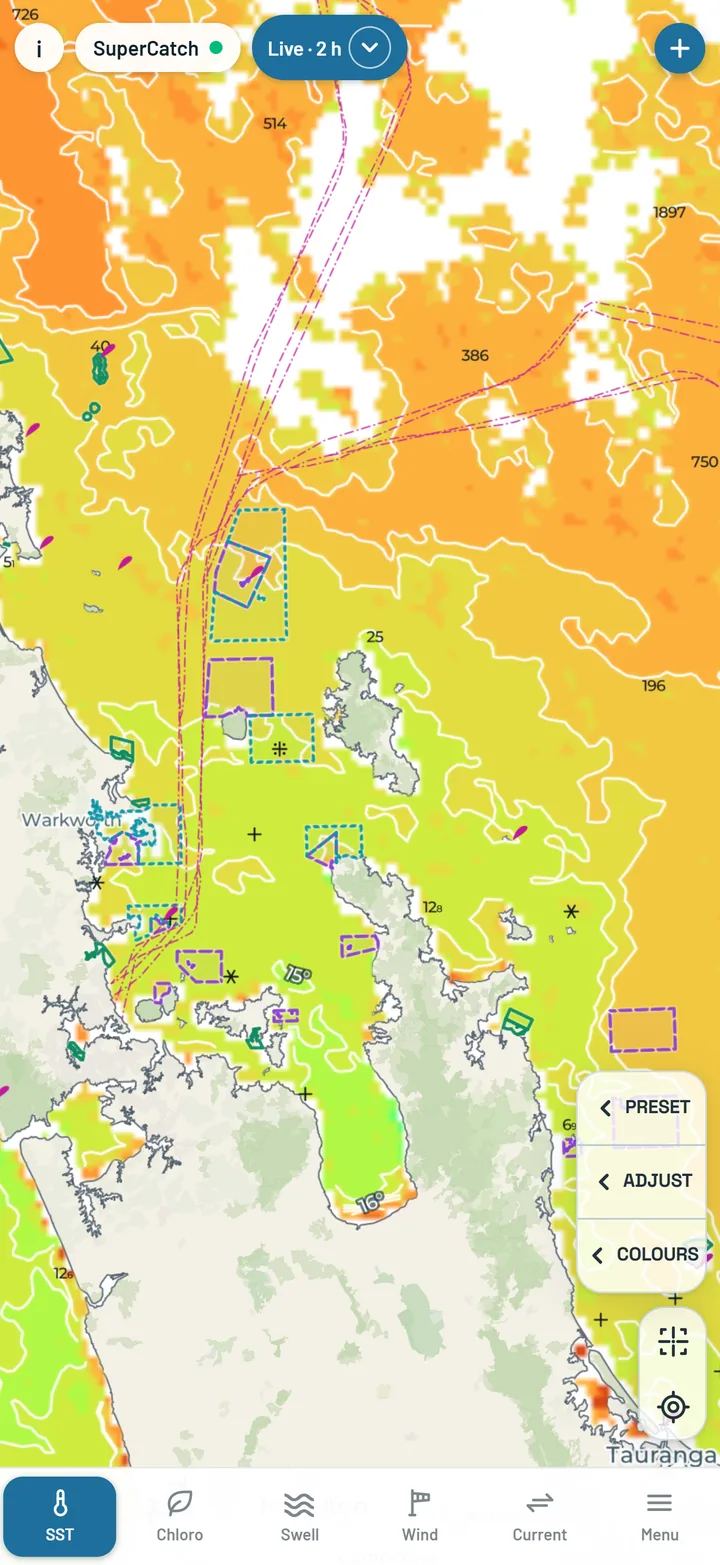
The sea surface temperature from the most recent hour, one colour for every half degree from purple in the coldest water to a strong red in the warmest (the darkest reds are kept for days when the range is wide), with isotherms drawn over it - every half degree zoomed in, thinned to about ten lines on screen as you zoom out. The satellite reads the heat the sea gives off, so it works through the night as well as the day.

Only one box is painted at a time: the box at the middle of the map, or the last box you tapped. Water outside every box is plain light blue - that is not a reading, just water we do not cover on Live and Day.

How old it can be

Each picture reaches the app about 1.5 to 3 hours after the satellite took it, so "Live" is the latest picture there is, not this minute. The pill says how old it is - Live · 3 h or similar - and adds · 40% cloud (or whatever the figure is) when more than 40% of the box is under cloud. When there is no picture at all it reads Live · cloud.

How to use it

Use Live for what the water is doing right now: how far a warm tongue has pushed since the morning, and where the clear sky is. Where cloud sat this hour there is no reading and the map is left bare - the next hour often opens it up, and SST Day fills it from the whole day. Right against the coast the hourly satellite often has no reading either (JAXA leaves out water it cannot read cleanly beside land) - use SST Stable there.
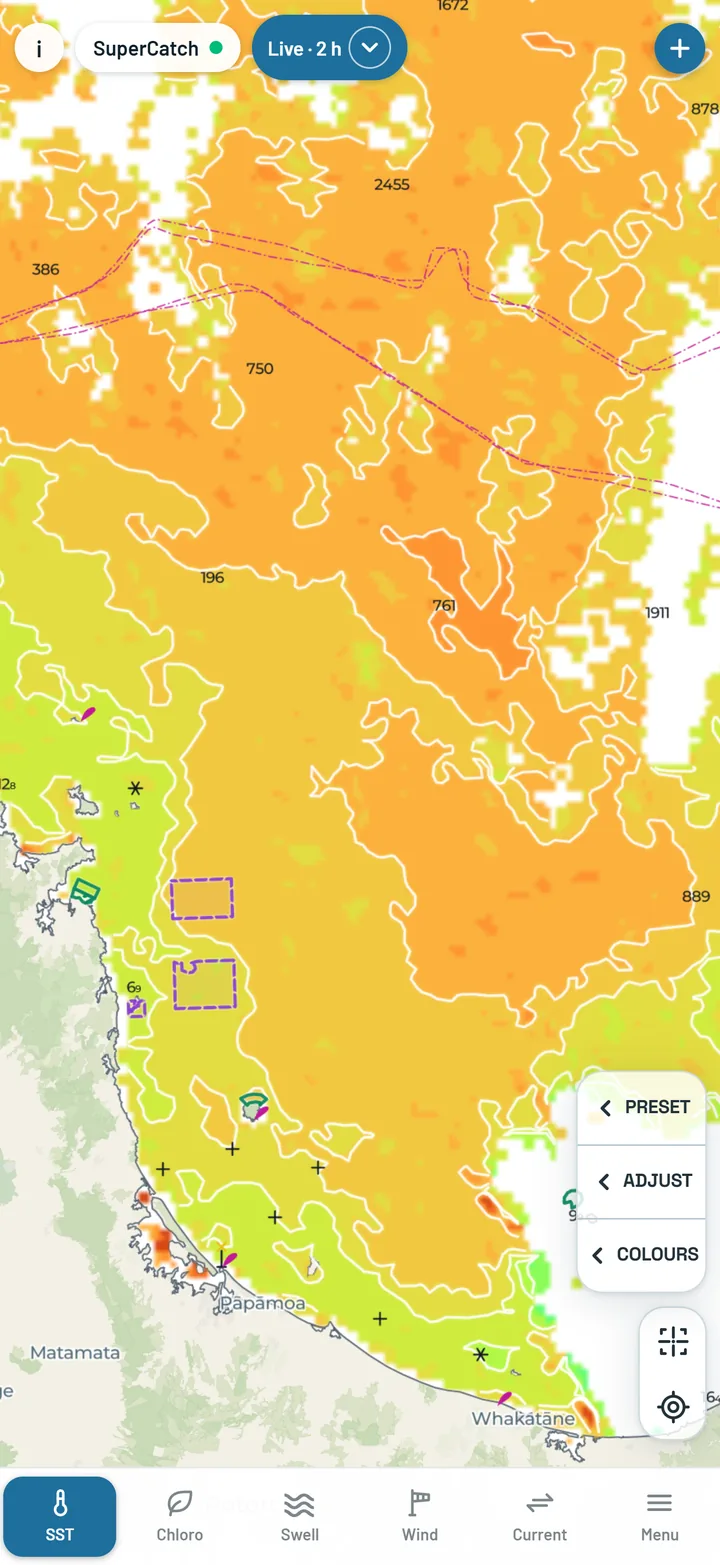
SST Live: this hour's sea temperature
SST Live: this hour, at 2 km.
The SST version menu: Live, Day and Stable
Switch between Live, Day and Stable.

SST Day - the 24-hour blend

Himawari-9, every look of the last 24 hours · ~2 km · a new stop every hour, 72 stops kept

What you see

One clean picture built from every clear look the satellite had in the last 24 hours - far fewer gaps than a single hour, and far less noise. Each hour a new 24-hour picture (a "stop") is made, and the app keeps the last 72 of them. Press play to run them as a movie, or drag the slider to any one.

How old it can be

The newest stop is a few hours old, for the same reason as Live: the pictures take time to reach us. Water that stayed under cloud for the whole 24 hours still has no reading and is left bare. Like Live, Day is coloured box by box, and only the box at the middle of the map is painted.

How to use it

This is the picture to read structure from. Step back a day or two: a front or a warm eddy that is still in roughly the same place is standing water worth planning around. SST Day is also the layer that travels offshore in your offline packs, slider and isotherms included.

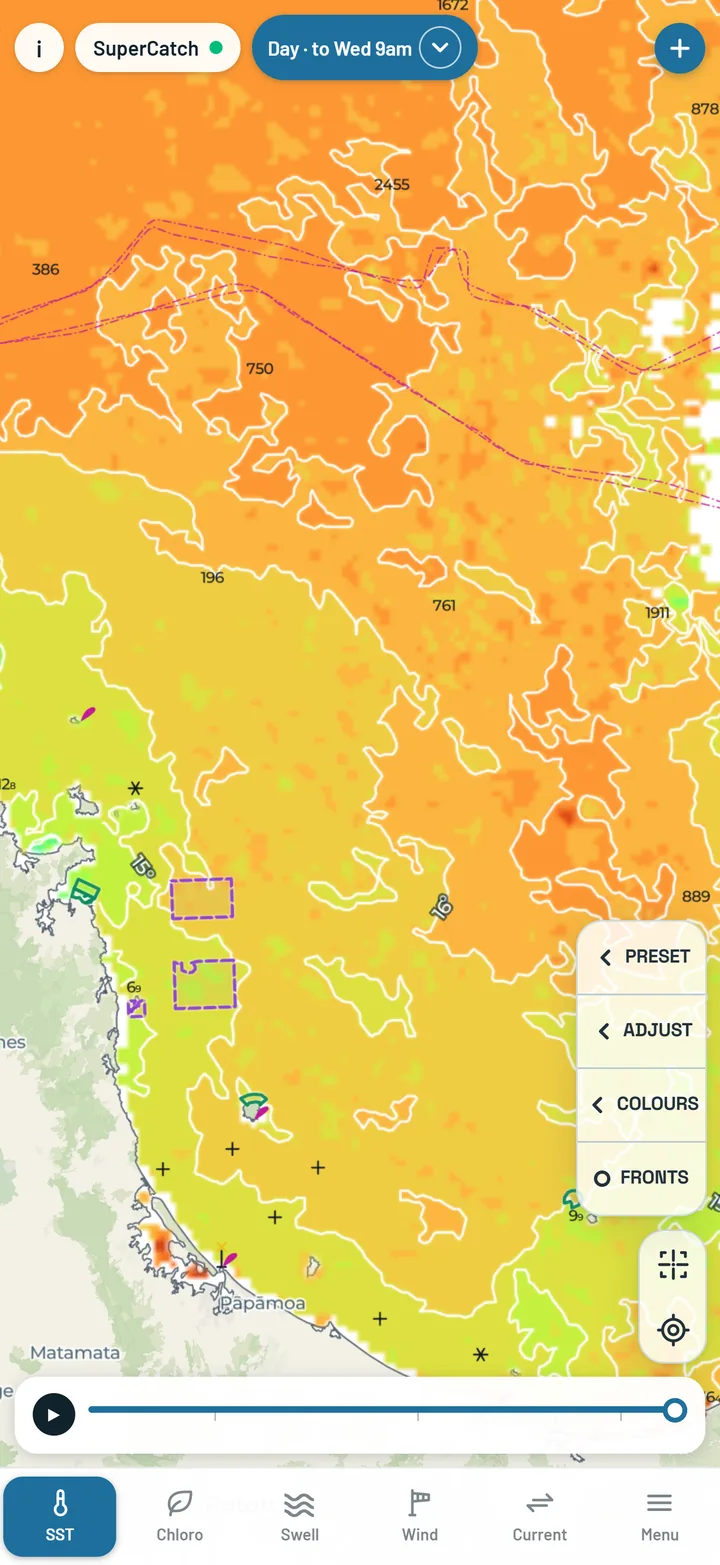
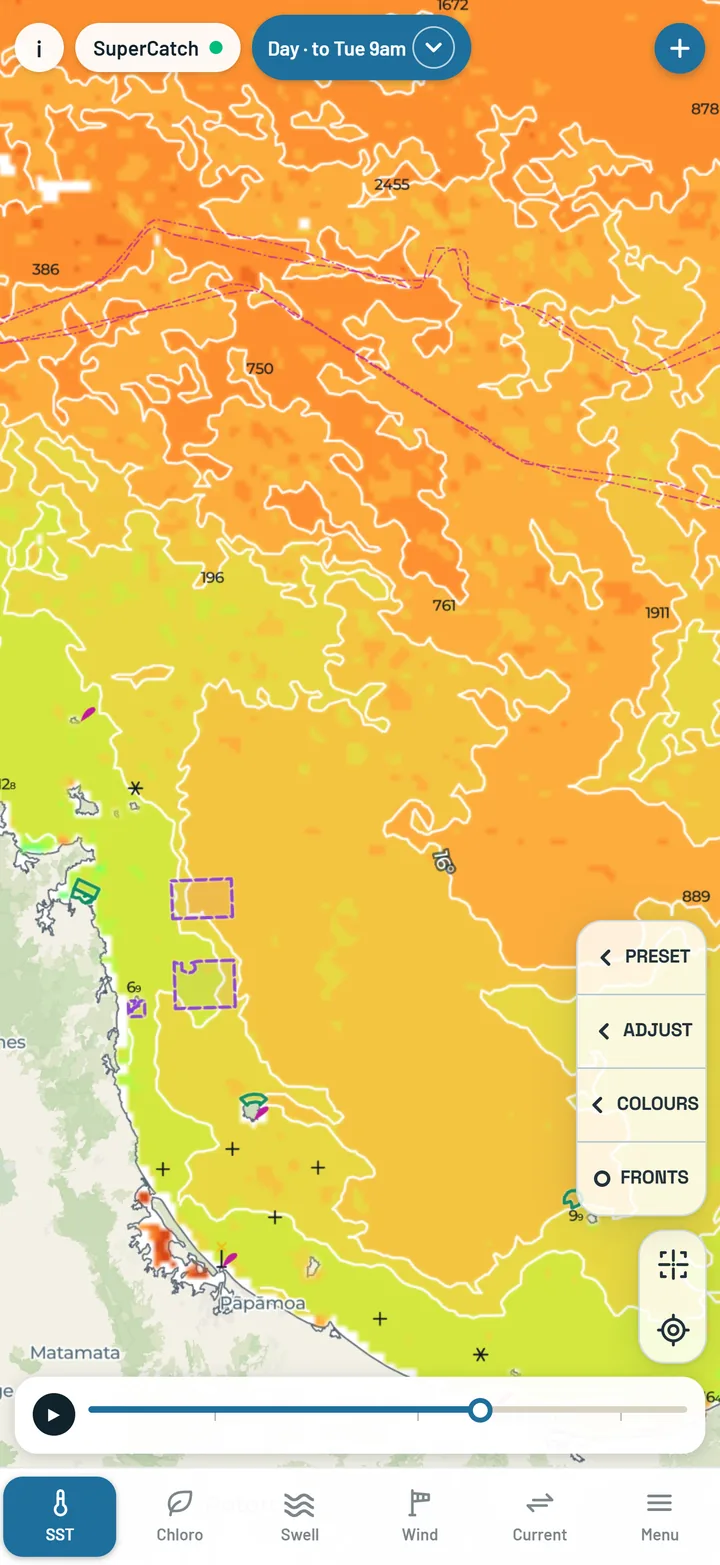
SST Day: the rolling 24-hour blend
SST Day with play and the slider.
Dragging the SST Day slider back through the hours
Drag back hour by hour.

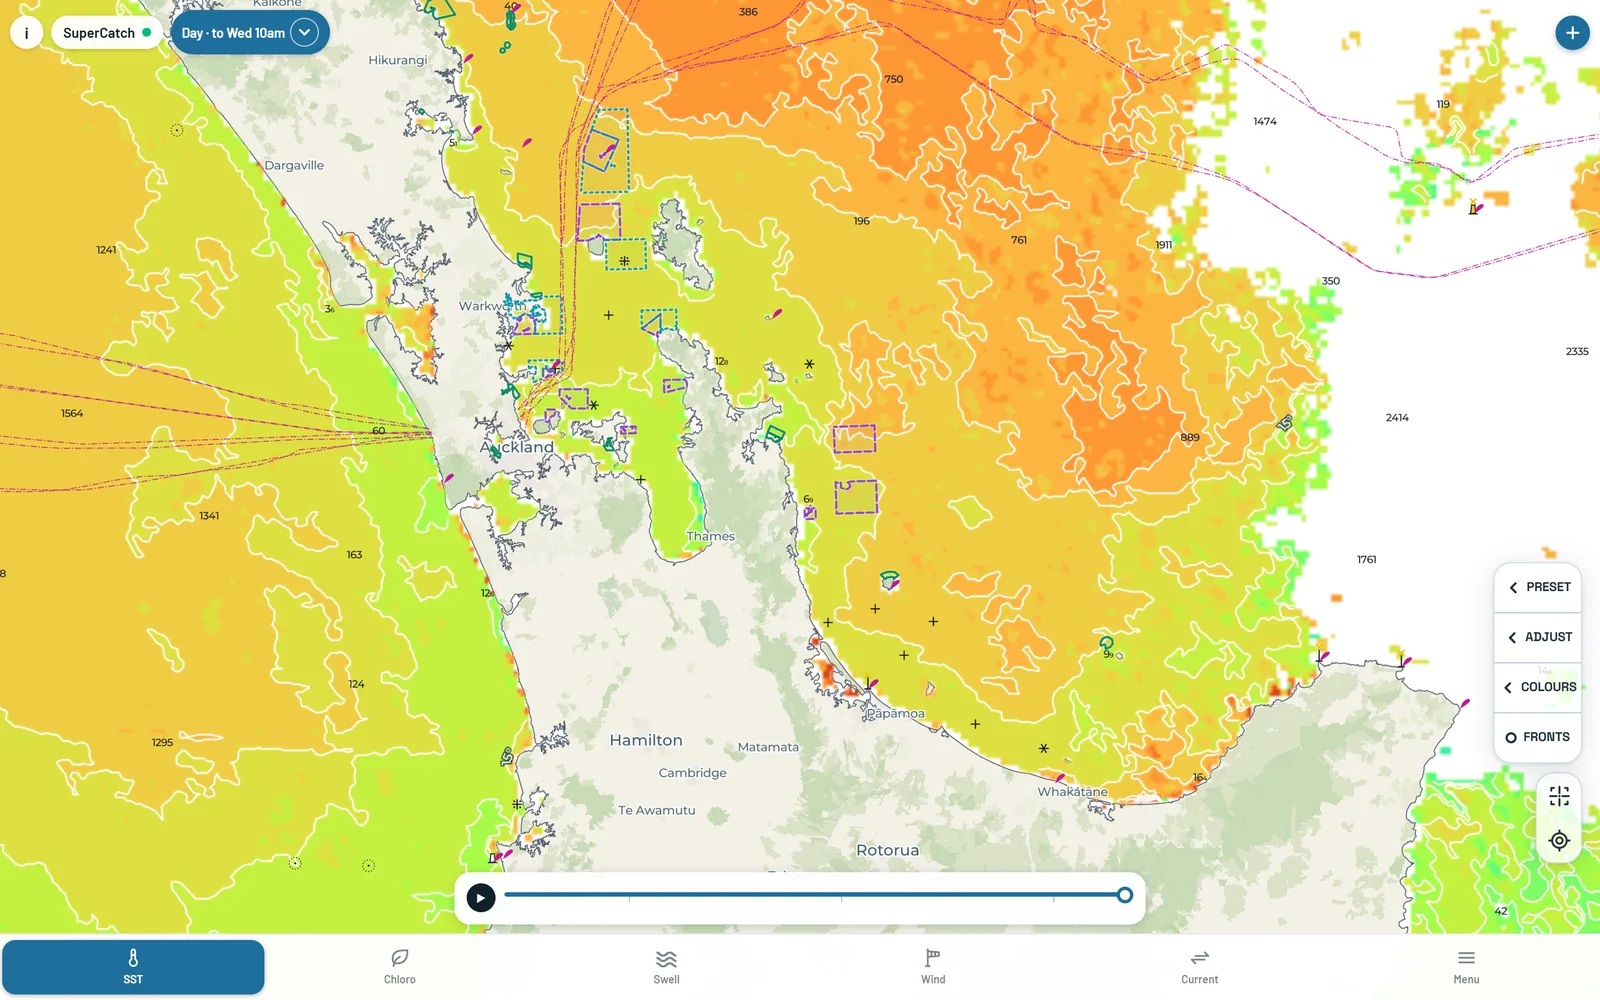
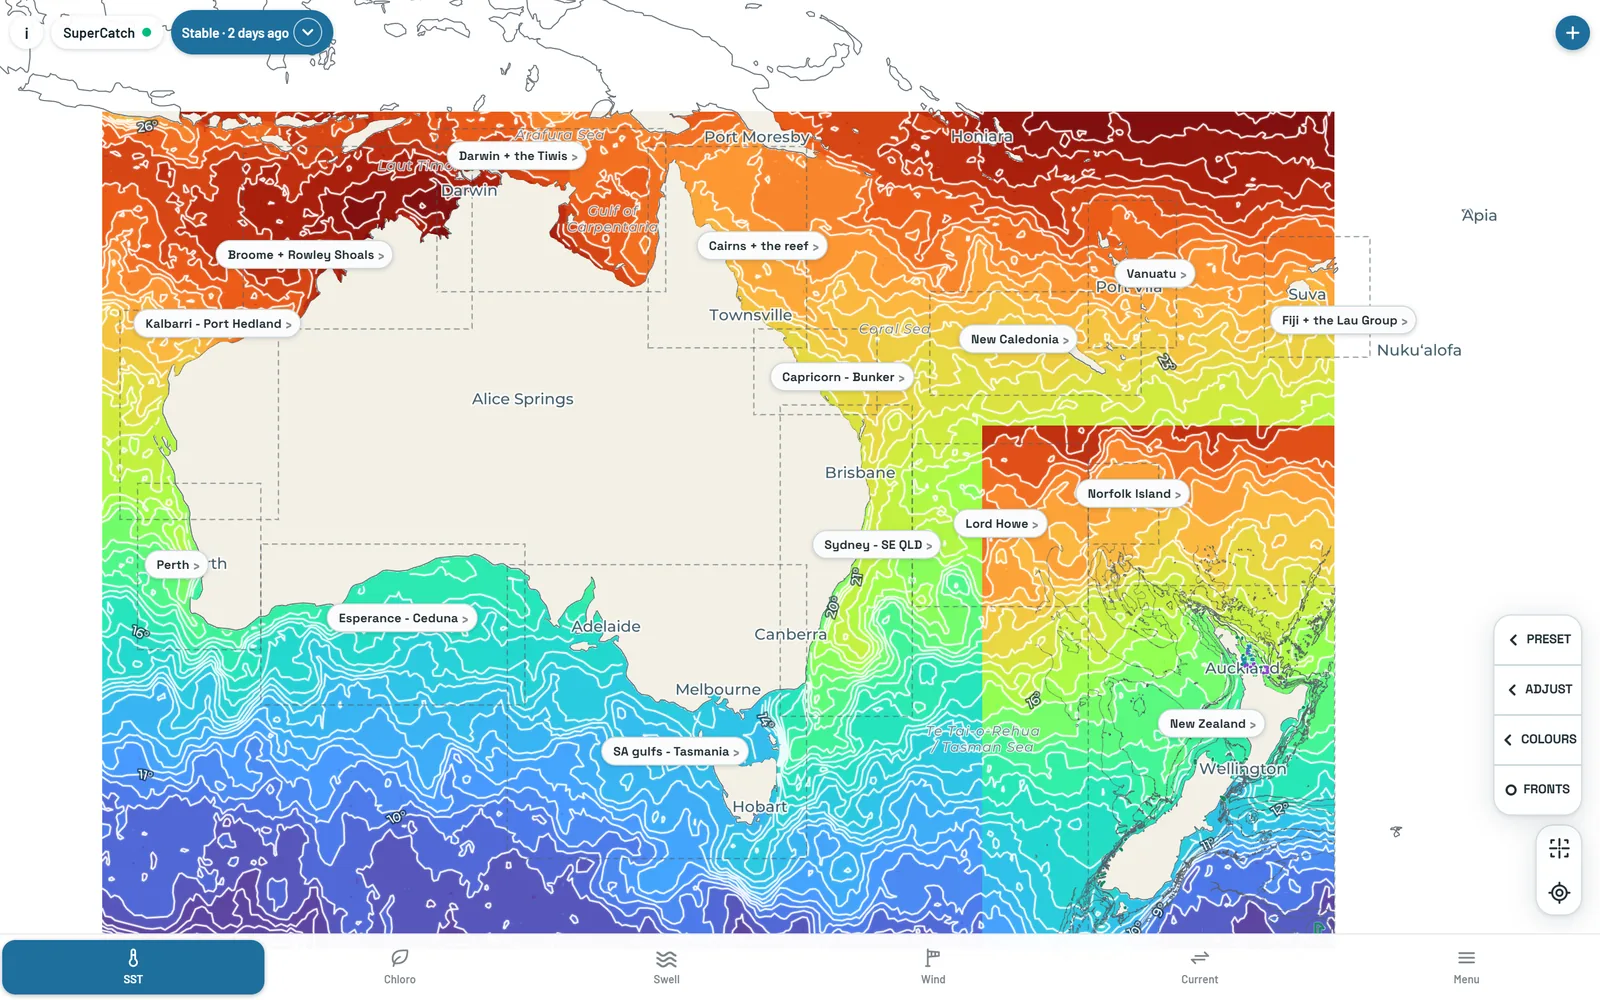
On a bigger screen

The same app on a laptop or desktop, with more water on screen at once.

SST Day on a desktop screen

SST Stable - two days, no gaps

MUR (NASA JPL) zoomed in, RAMSSA (Bureau of Meteorology via IMOS) for the whole-country view · daily analysis · a day or two behind, no gaps, New Zealand, Australia and the Pacific to 180°

What you see

A daily analysis that blends several satellites with ship, buoy and float measurements into one gap-free field - there is no cloud and no grey on Stable. On Stable, New Zealand and Australian waters each get their own colour zone, so the ramp is spent on the temperatures you actually fish (Live and Day are coloured per box instead).

How old it can be

A day or two behind the water: the providers wait for every satellite and buoy before they publish the day. Because it is filled in mathematically between measurements, it is smoother than the hourly picture and will miss small, fast features.

How to use it

Start here for the broad picture - where the warm water sits, everywhere at once, cloud or no cloud - and inshore, in harbours and enclosed water where the hourly satellite reading stops short of the coast. Then switch to Day or Live for the sharp edge.

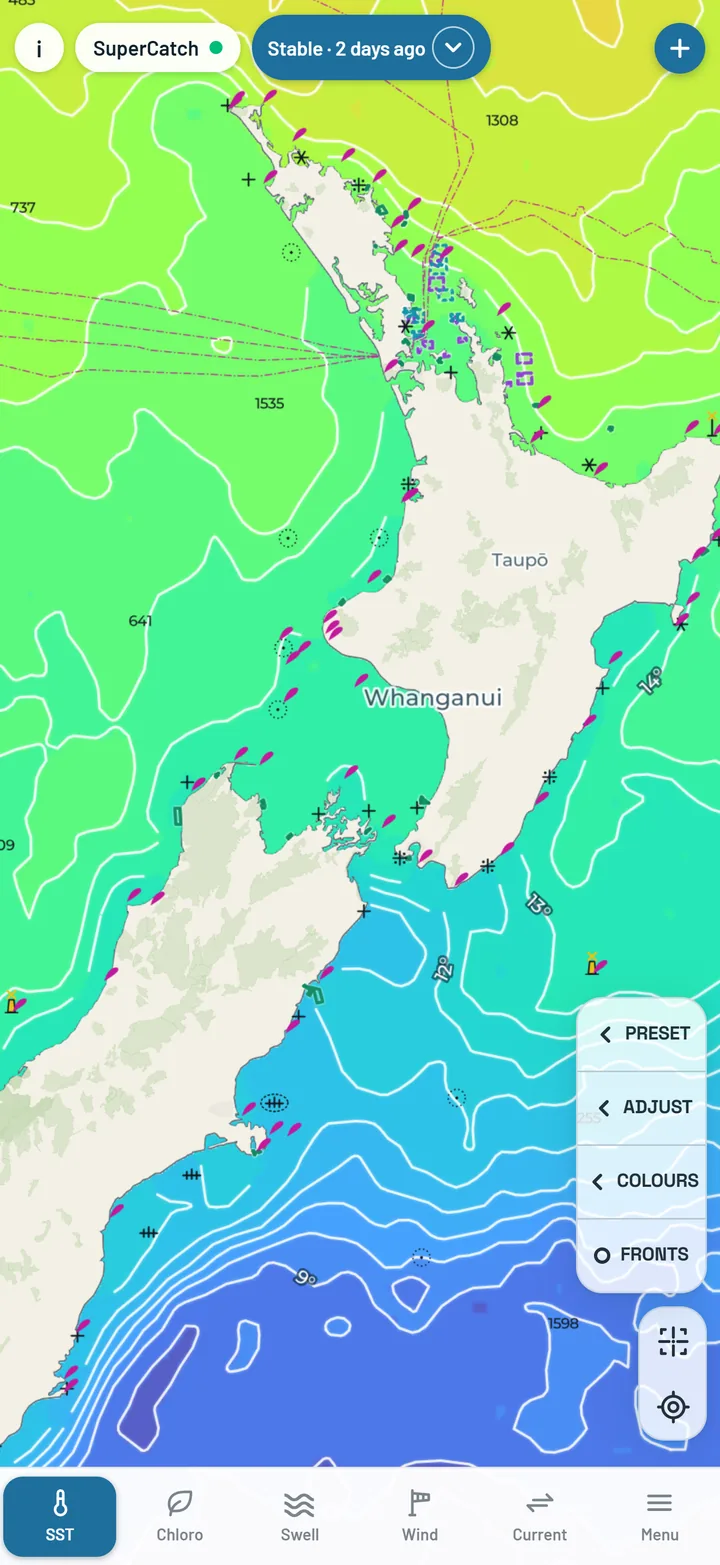
SST Stable over New Zealand
New Zealand zone.
SST Stable over Australian waters
Australian zone.

Your colours, your range

What you see

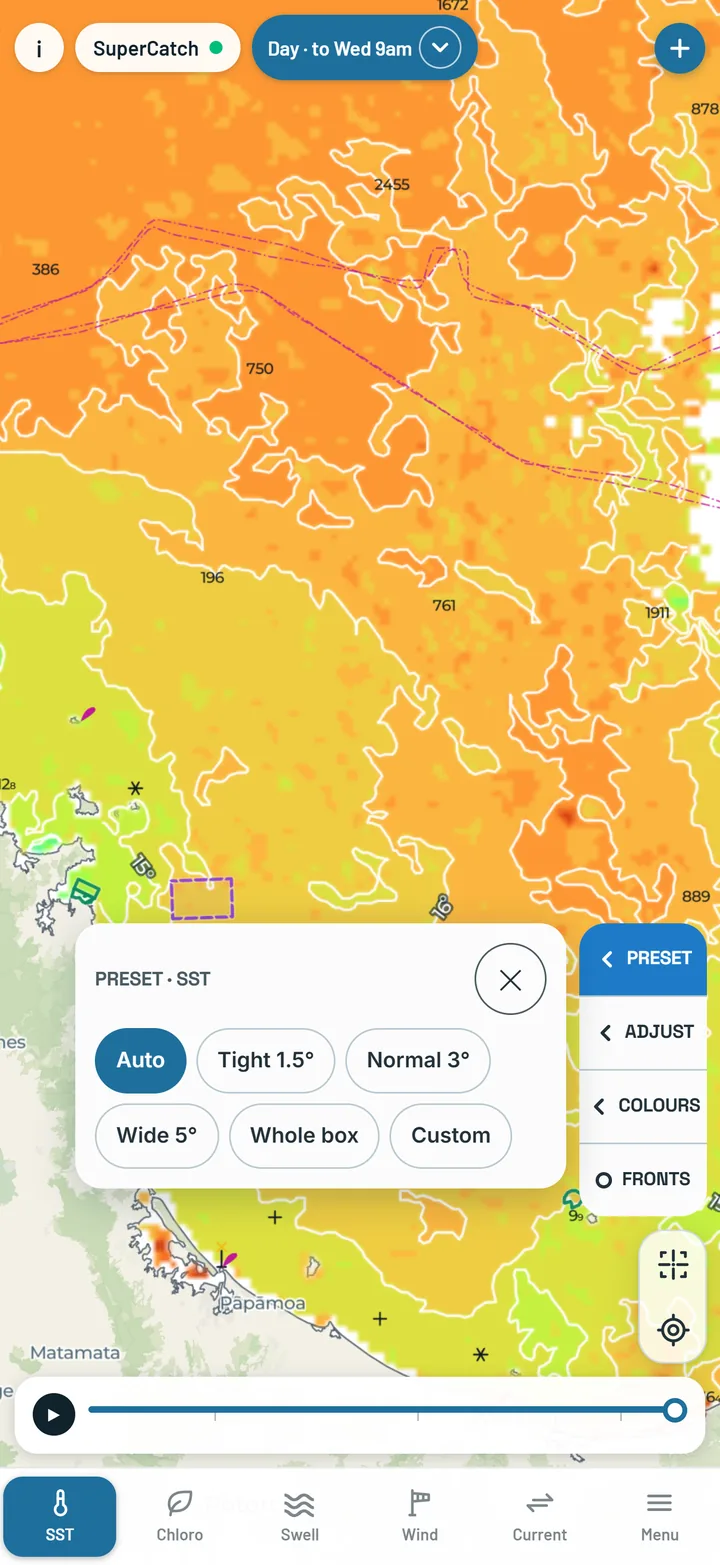
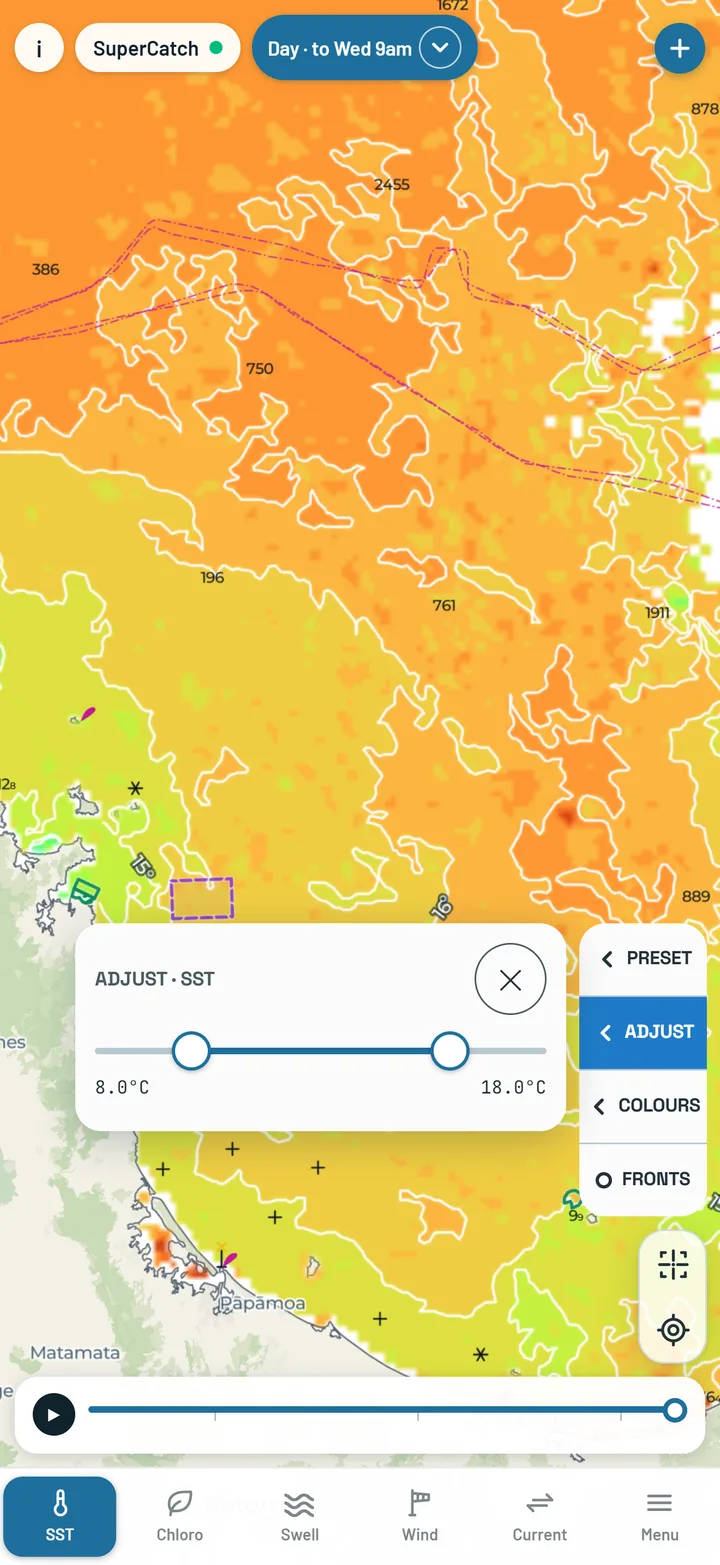
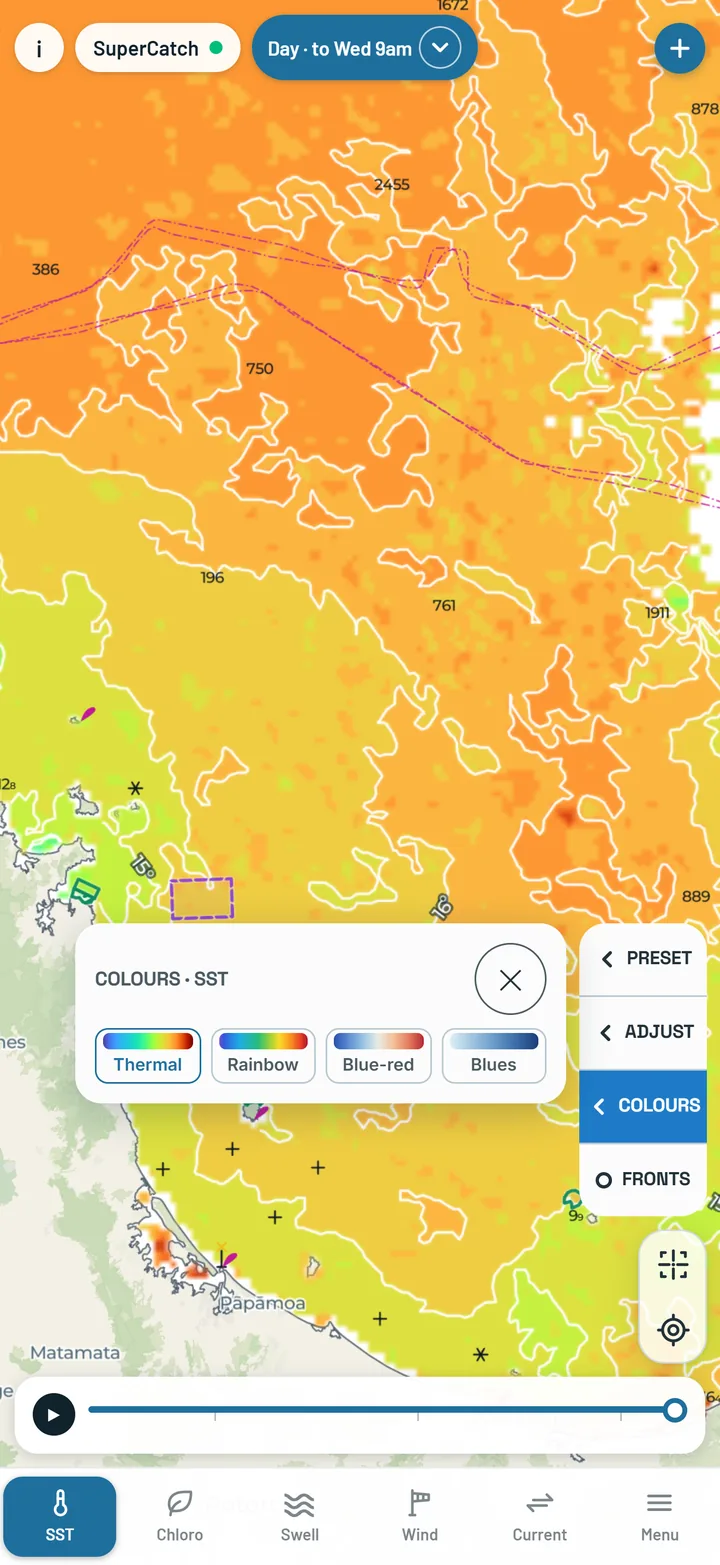
Three buttons on the right of the map, on SST and Chloro. Preset picks a ready-made range, Adjust is a two-handle slider for your own lower and upper limit, and Colours picks the colour ramp. Each opens only its own control, the map redraws as you drag, and whatever you pick sticks for that layer. On SST the default is Auto. On Chloro the default is the preset Fishing 0.1-2.0.

How to use it

Narrow the range to the band you care about - a couple of degrees either side of the water you are chasing - and small differences stand out. The (i) in the top bar explains the layer in plain words.

Preset open on SST: ready-made colour ranges beside the map
Preset.
Adjust open on SST: a two-handle temperature slider
Adjust.
Colours open on SST: the four colour choices
Colours, one tap.
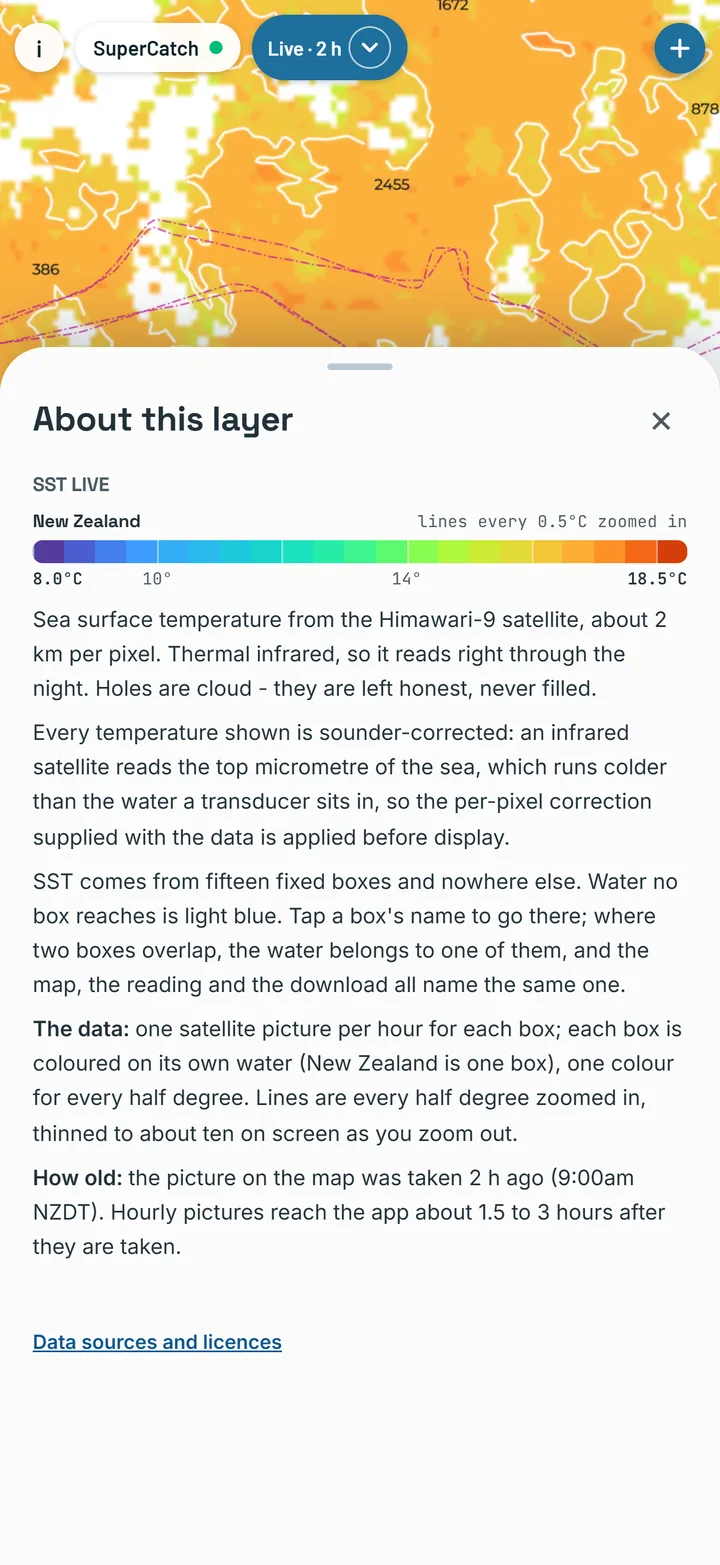
About this layer for sea temperature
About this layer.

Fronts

SST Day, SST Stable, Chloro Day and Chloro Stable · off until you turn it on

What you see

A FRONTS button sits on the map under Preset, Adjust and Colours on SST Day, SST Stable, Chloro Day and Chloro Stable. It is not on the Live versions or on Swell, Wind or Current, and it is the same switch on all four. Turn it on and a rose-pink line, with light running along it, is drawn on the fronts - where warm water meets cool on SST, where green water meets blue on Chloro. Each part of the map is tested for two different waters side by side, and the line is drawn only on the boundary between them, so a day with no clear boundary shows none. Gentle water gets nothing, and it is never drawn along the coast.

Where it comes from

On SST Day the fronts are found in the same 24-hour picture you are looking at. On Chloro Day they come only from water Sentinel-3 actually measured, never from the filled-in parts. On the two Stable versions they come from that day's gap-free analysis. So a front is as old as the picture under it.

Good to know

It is pink because the isotherm lines are white, and a white glow would disappear into them. The light only moves while a front is on screen; with Reduce Motion switched on in your phone's settings it holds still. A front is a boundary between two bodies of water - it says nothing about fish on its own, but it is where bait tends to gather (see The science).

Fifteen boxes

SST Live and Day · New Zealand, Australia and the Pacific from Lord Howe to Fiji · each box on its own local time

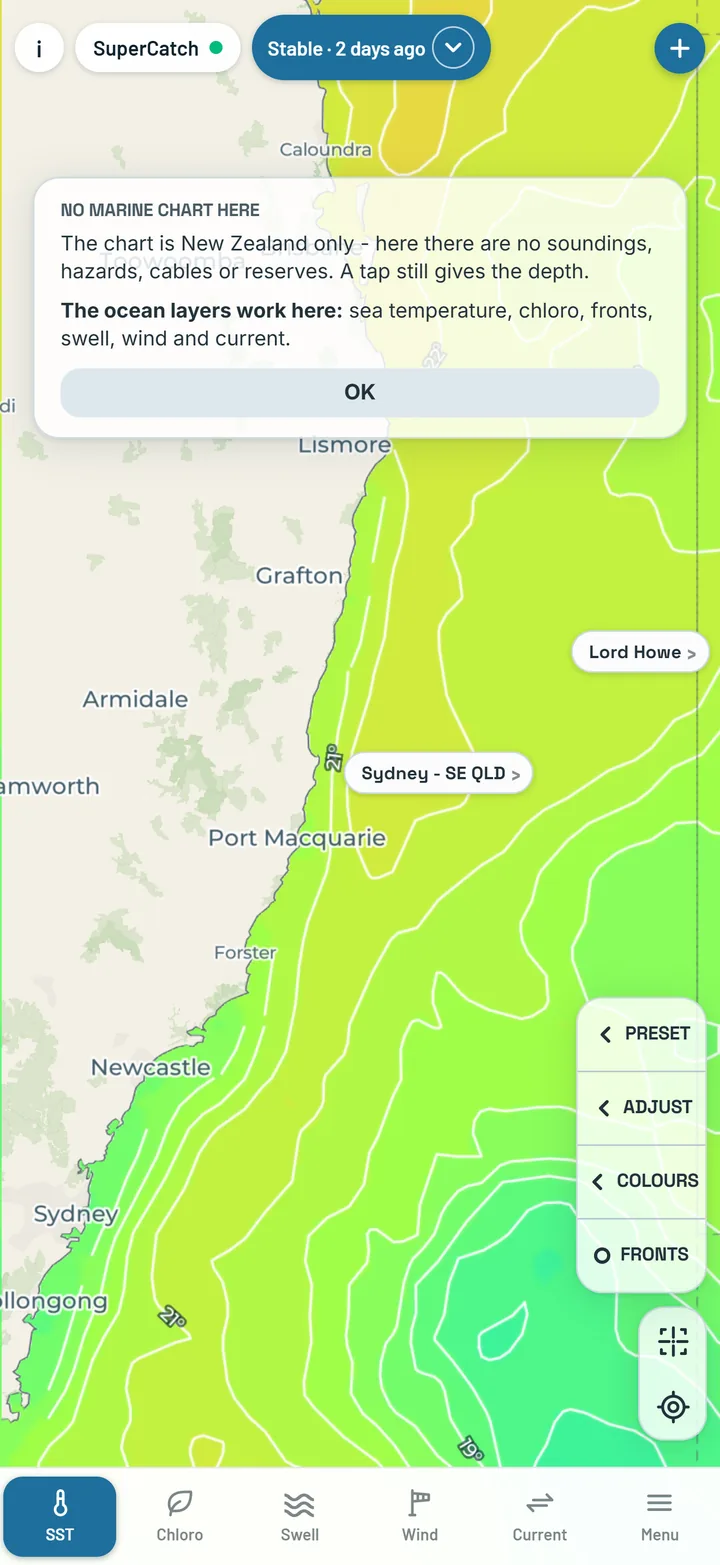
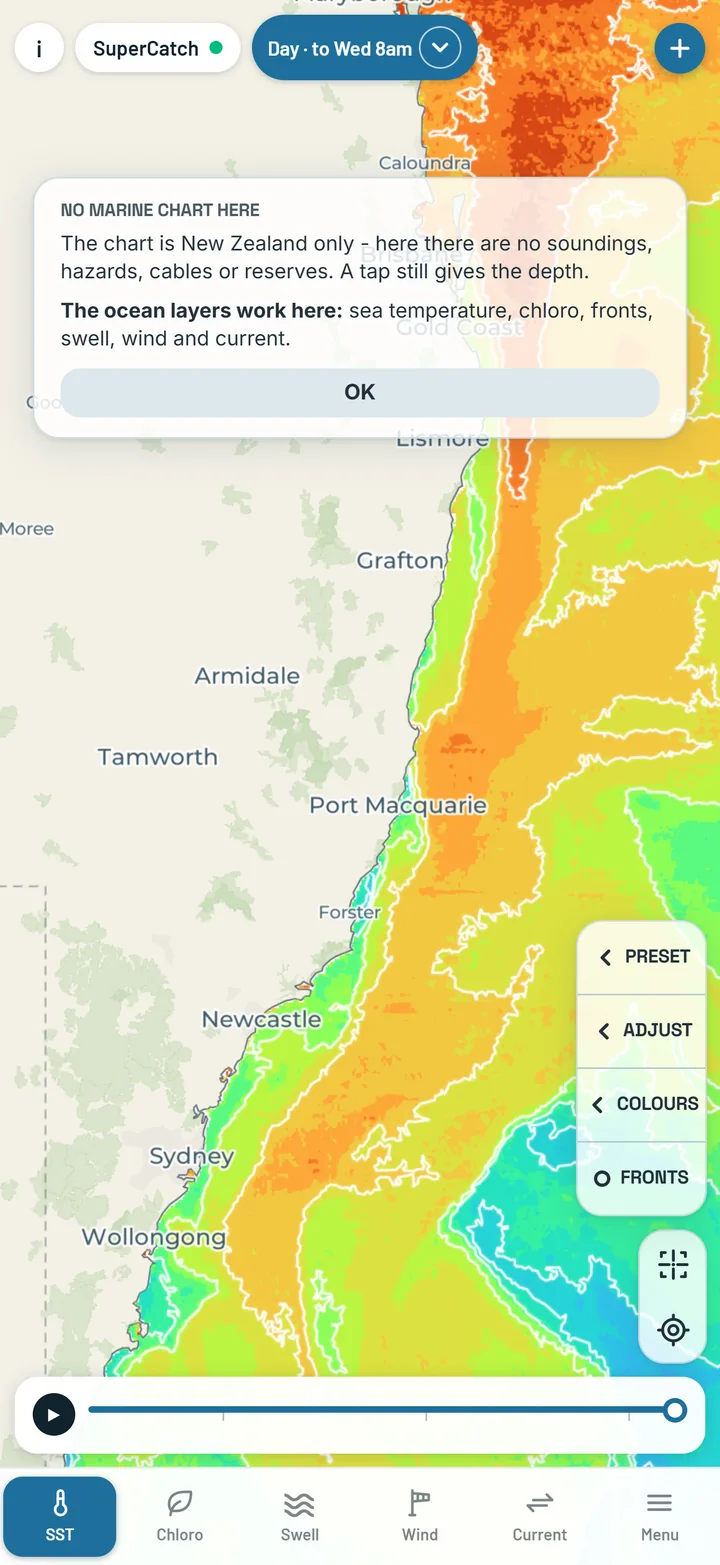
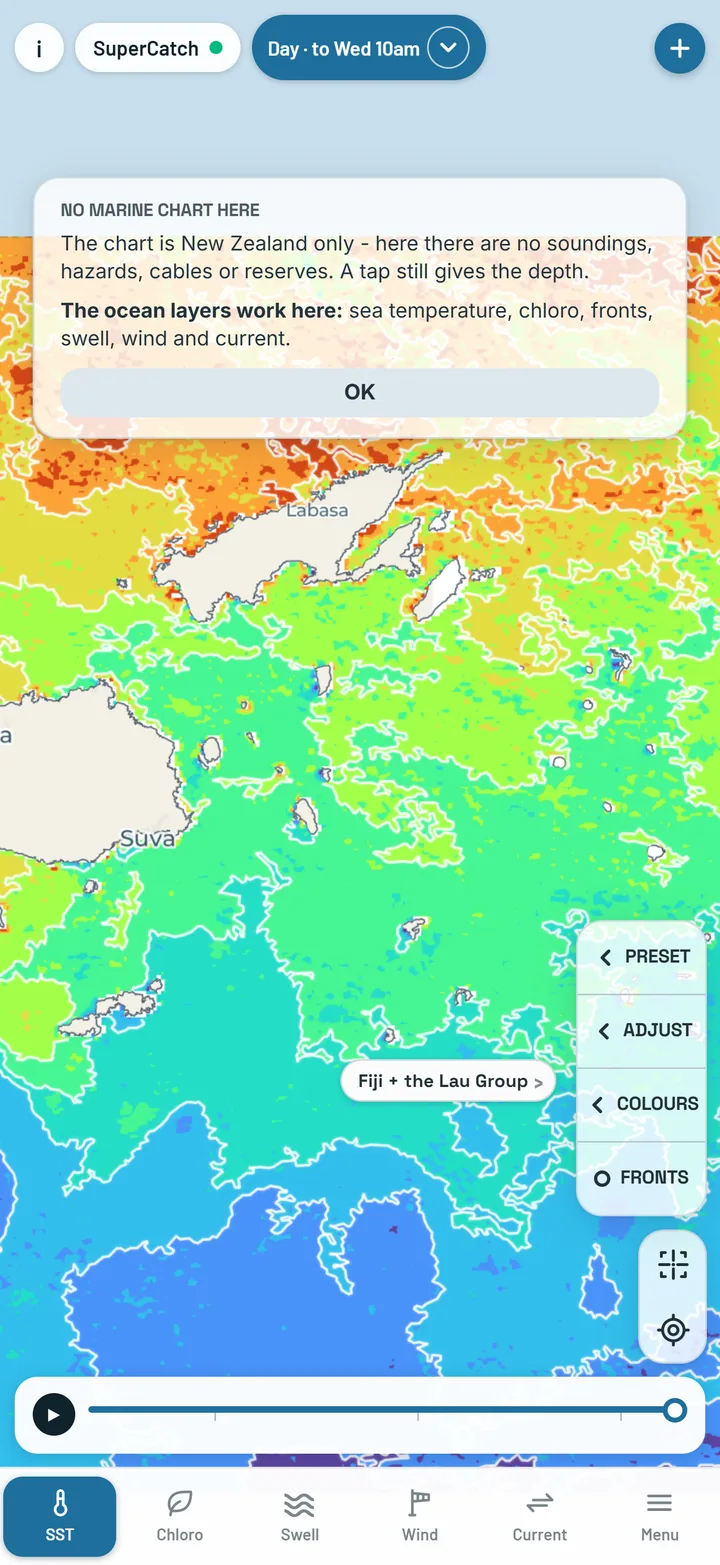
New Zealand (one box, North Island and South Island on one scale) and fourteen more: Cairns + the reef, Darwin + the Tiwis, Broome + Rowley Shoals, Kalbarri – Port Hedland, Perth, Capricorn – Bunker, Sydney – SE QLD, SA gulfs – Tasmania, Esperance – Ceduna, Lord Howe, Norfolk Island, New Caledonia, Vanuatu, and Fiji + the Lau Group.

On Live and Day the box at the middle of the map is the one painted - pan, and the next box takes over; tap inside a box to pick it. Water outside every box is plain light blue. SST Stable is not split into boxes.

All fifteen coverage boxes on a desktop screen
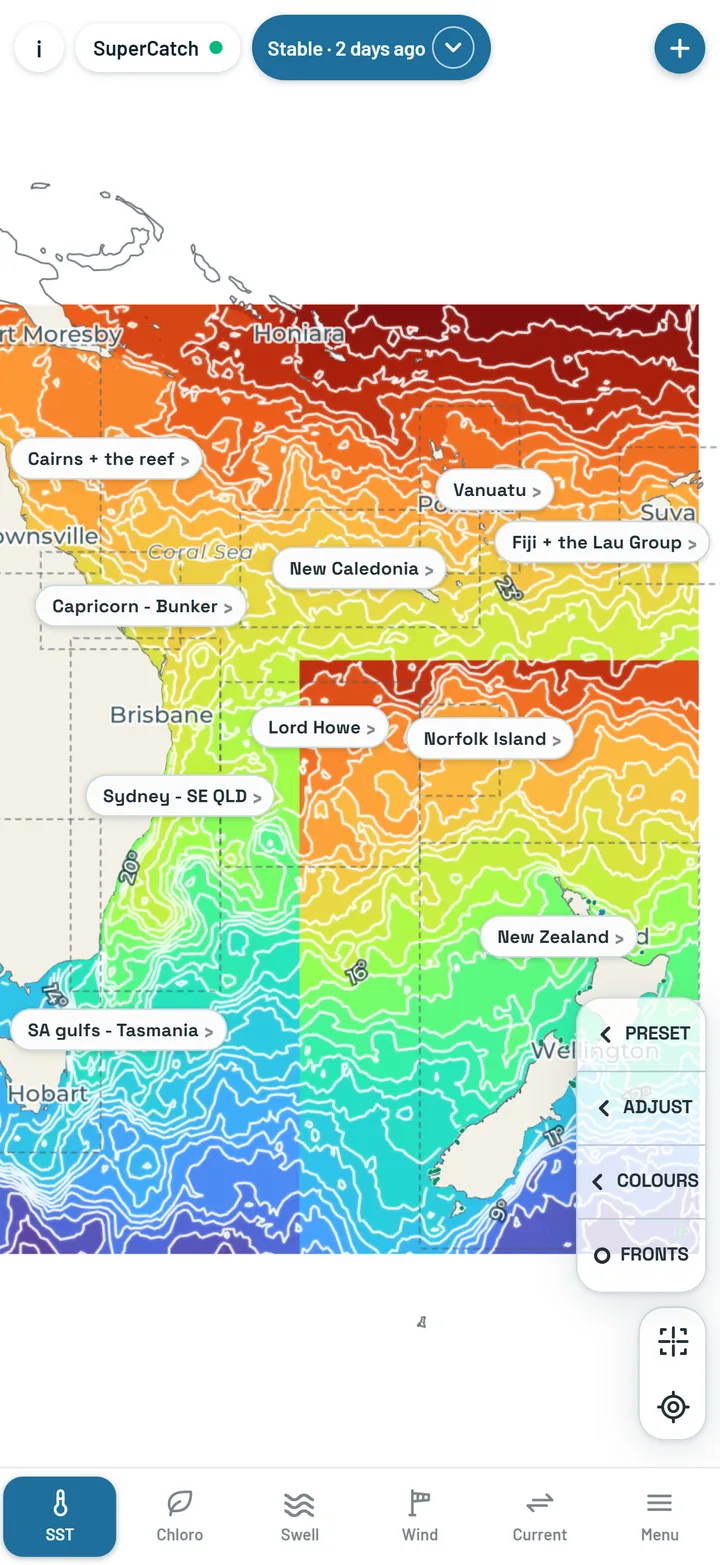
The boxes zoomed out
Zoomed out.
Cairns and the reef
Cairns + the reef.
Sydney to south-east Queensland
Sydney – SE QLD.
Fiji and the Lau Group
Fiji + the Lau Group.

What it is measured from

Live and Day

Himawari-9, the Japanese weather satellite that sits over the same spot on the equator and is used here through JAXA, reads the infrared each patch of sea gives off, several bands at once so water vapour can be corrected for. It sees our part of the Pacific every ten minutes; the hourly product merges those looks. Infrared reads the top few micrometres of the sea, which runs a little cooler than the water your transducer sits in, so every Himawari temperature carries JAXA's own per-pixel correction - about +0.46 °C over New Zealand. Checked against 57 sensor casts from fishing boats, the corrected reading sits within 0.04 °C of the boat.

Stable

Zoomed in, Stable is MUR, NASA JPL's daily analysis at about 1 km, which blends infrared and microwave satellites with ship and buoy measurements into one gap-free field (NOAA's blended analysis stands in if MUR is late). Zoomed out to the whole country it is RAMSSA, the Australian Bureau of Meteorology's regional analysis. Because both are interpolated they have no cloud gaps, and they are smoother than the hourly picture. Stable reaches east to 180° - not past it to the Lau Group.

So Stable tells you where to start, Day shows you the structure, and Live shows you the water this hour.

Chloro

The bottom of the food chain, mapped.

Chlorophyll is the pigment in phytoplankton - the reason bait, and everything that eats bait, is there at all. Chloro has three versions: Live, Day and Stable.

Chloro Day - the sharp blend

Sentinel-3 OLCI (ESA / EUMETSAT), filled from Himawari-9 · about 1 km · one picture a day, New Zealand only (166-180°E)

What you see

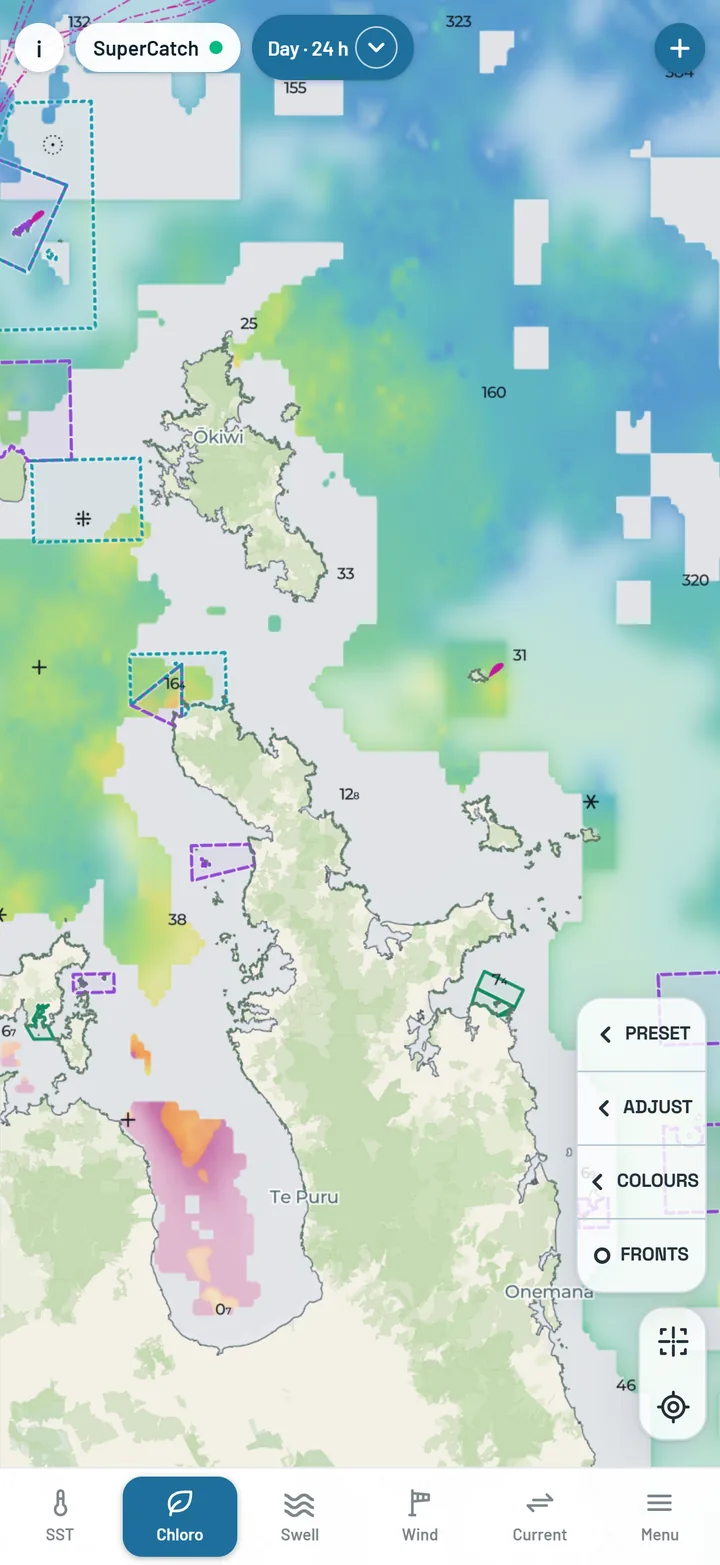
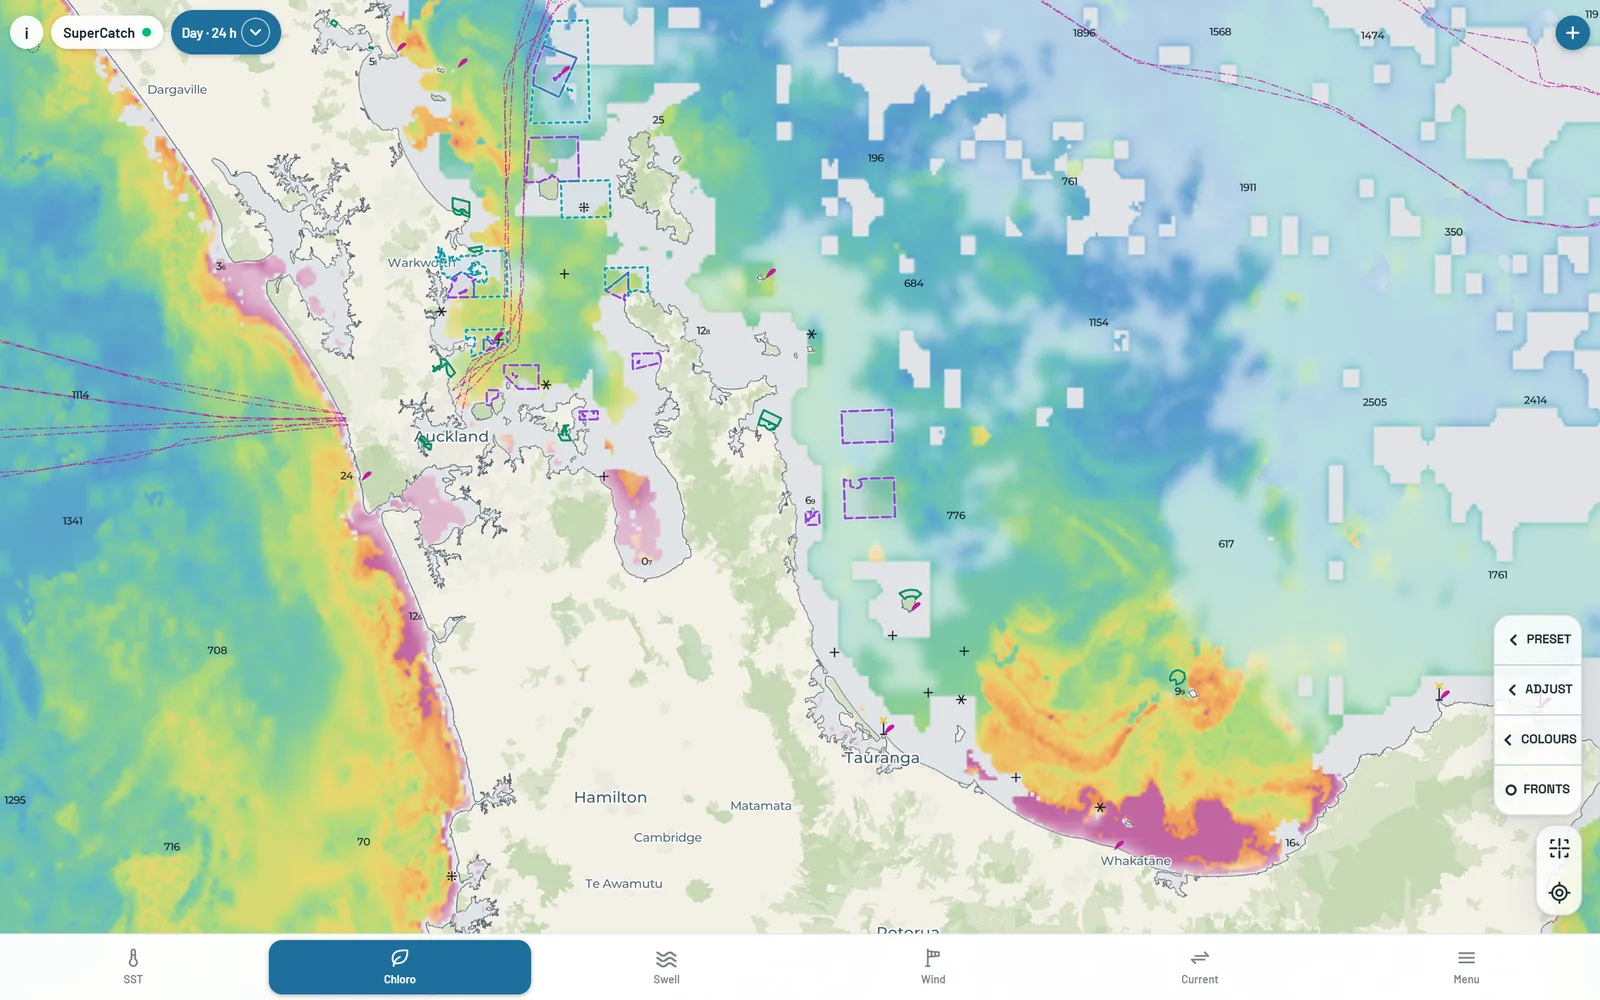
One sharp picture of New Zealand's water each day. Wherever Sentinel-3 saw clear water it is drawn at its full detail - fine enough to show the eddies and filaments along a colour edge. The gaps between are filled softly from Himawari's daily picture, and the cloud Himawari saw when Sentinel-3 went over is drawn as soft white cloud, so you always know which is which. Grey means no reading that day: no satellite saw the water clearly - cloud, or too close to land for a clean reading.

How old it can be

Each day is built in the early afternoon, New Zealand time, once that morning's Sentinel-3 passes are in. The age on the pill is the time Sentinel-3 went over. A day with no Sentinel-3 pass is never shown - you keep the last real one, with its true age.

How to use it

Read it for edges: where green water meets blue, and where that edge lines up with a temperature break. Like every Chloro version, the colour stops at the edge of the palest chart band, about 30 m deep - closer in, the seabed and river runoff skew what the satellite sees. Tap shallower water and the card says so.

Chloro Day around New Zealand
Chloro Day.
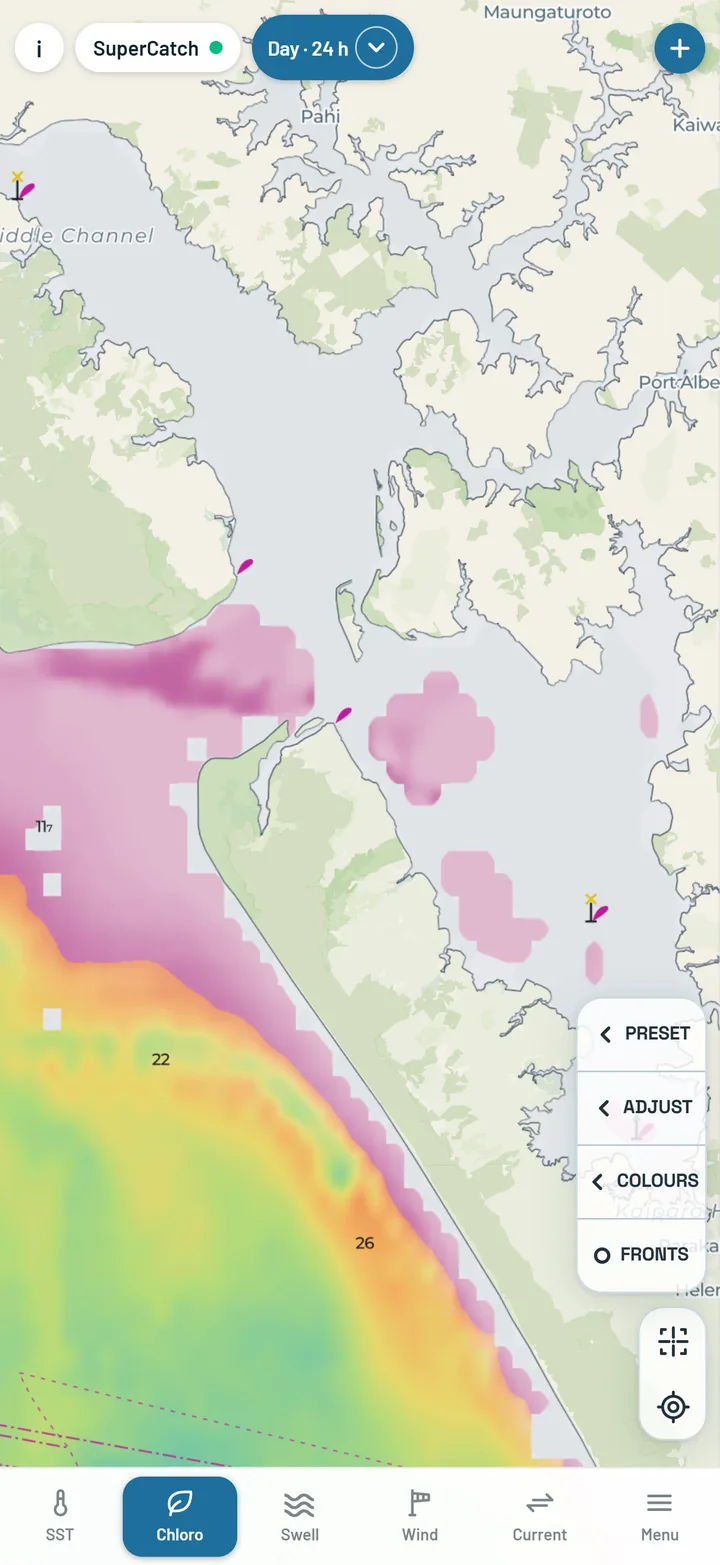
Chloro Day in Golden Bay: the colour stops at the edge of the palest chart band, short of the shallow flats under Farewell Spit
The colour stops at the palest chart band, about 30 m.

Chloro Day on a bigger screen

At desktop size you can read the fine Sentinel-3 detail over a whole stretch of coast.

Chloro Day on a desktop screen

Chloro Live - this hour

Himawari-9 ocean colour · ~5 km · hourly, through the daylight

What you see

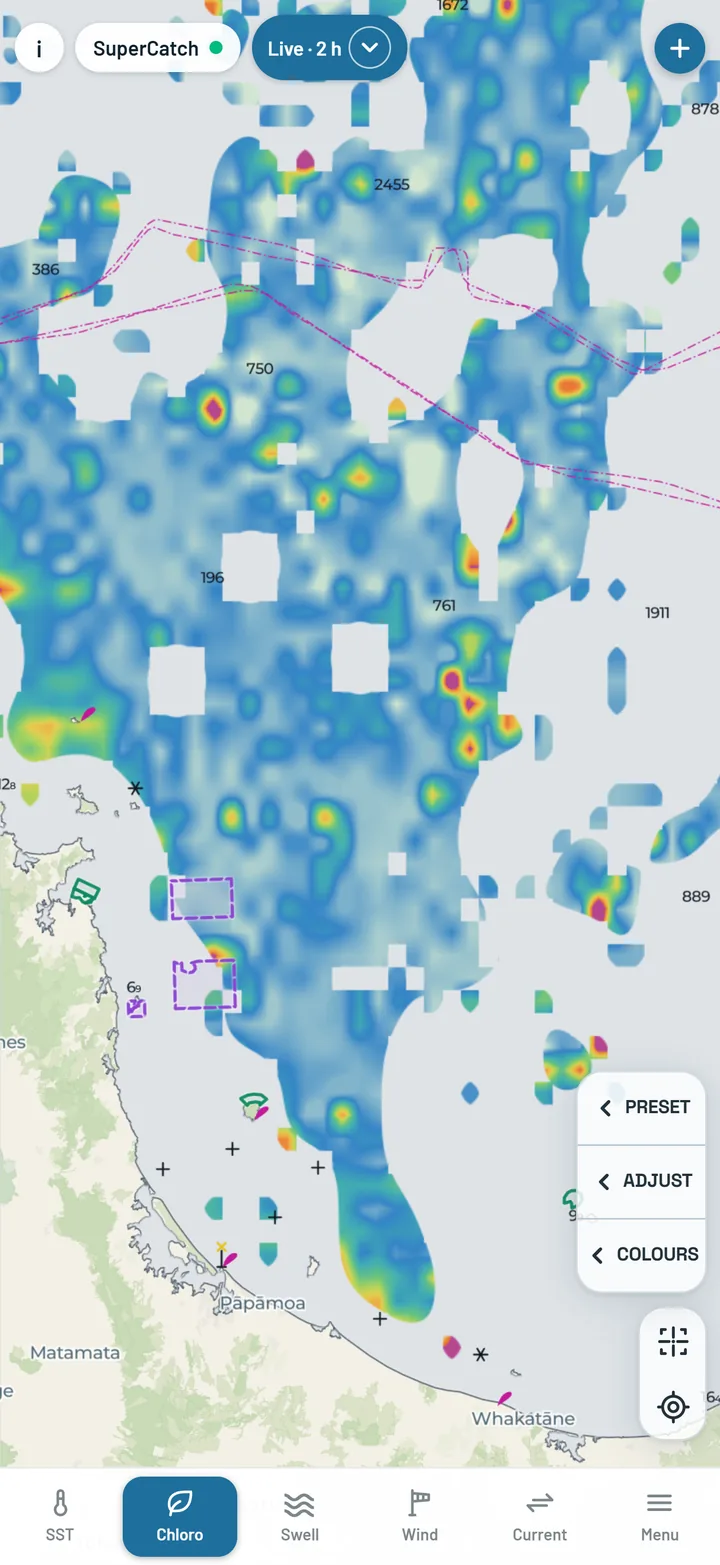
The same-day ocean colour from Himawari, a new picture every daylight hour. Grey means no reading this hour - cloud, or too close to land for a clean reading. The colour stops at the edge of the palest chart band, about 30 m deep, as on every Chloro version.

How old it can be

Ocean colour is reflected sunlight, so there are only daylight pictures. After dark (once the sun was below 5° when a picture was taken) the map keeps showing the evening's last daylight picture, and the pill says how old it is - by early morning it is the whole night old.

How to use it

Use it to see how a colour edge has moved since yesterday's Chloro Day, and to check the water in the afternoon before you head out.

Chloro Live: this hour's ocean colour
Chloro Live.

Chloro Stable - two days, no gaps

Copernicus Marine GlobColour · 4 km, gap-free · about two days behind

What you see

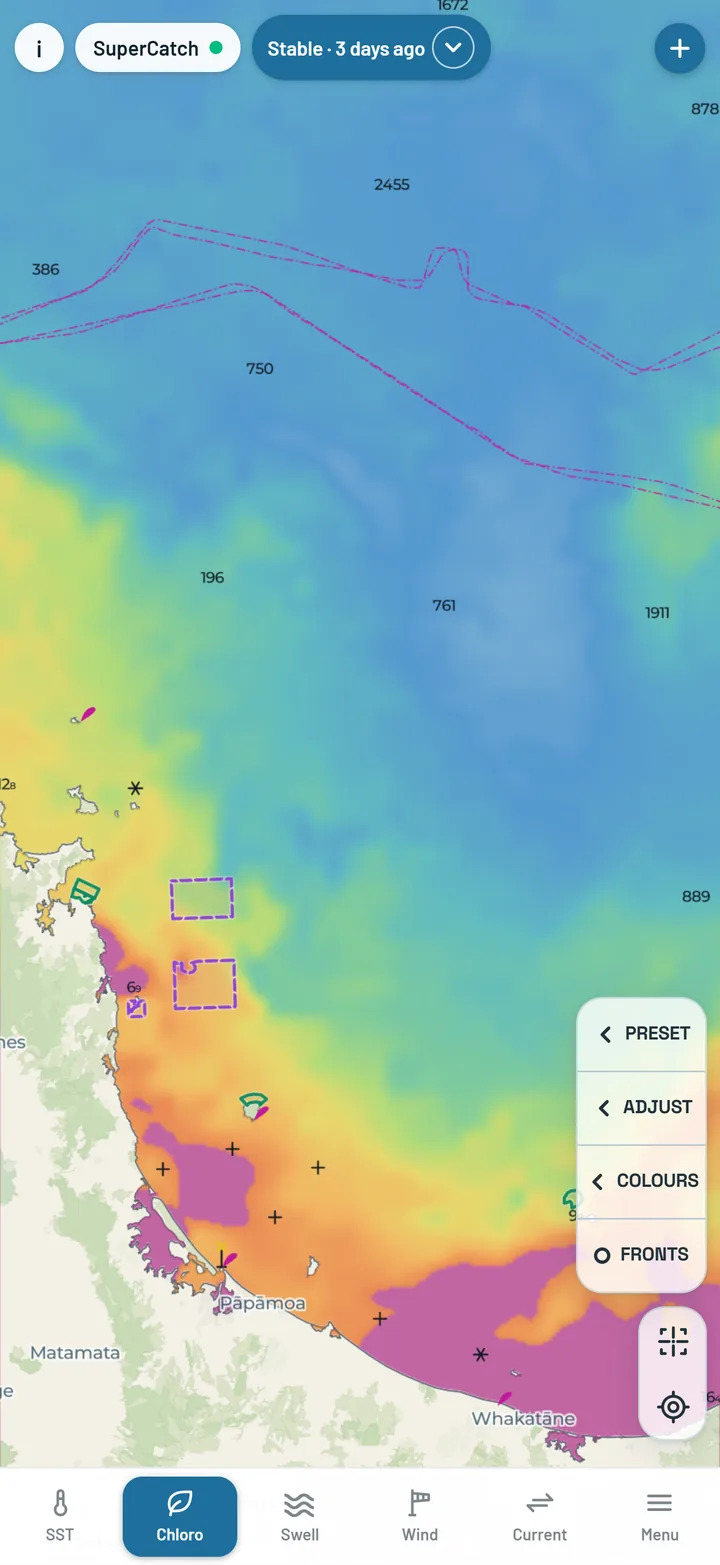
A complete chlorophyll picture with no cloud gaps, painted on the same scale as Live and Day, over New Zealand and every box. Like the other versions it stops at the edge of the palest chart band, about 30 m deep. There are no stripes or hatching on any layer.

How old it can be

About two days behind the water - ocean colour is published late. The whole map shows one published day, the same day everywhere.

How to use it

Start here for where the green water sits, everywhere at once, then go to Day for the sharp edge. In shallow water - under 10 m in New Zealand, under 30 m in Australia - the seabed itself can colour the reading, and a tap there says so (Chloro Live says the same; on Chloro Day the note starts under 20 m).

Chloro Stable
Chloro Stable.

What it is measured from

Colour, read from space

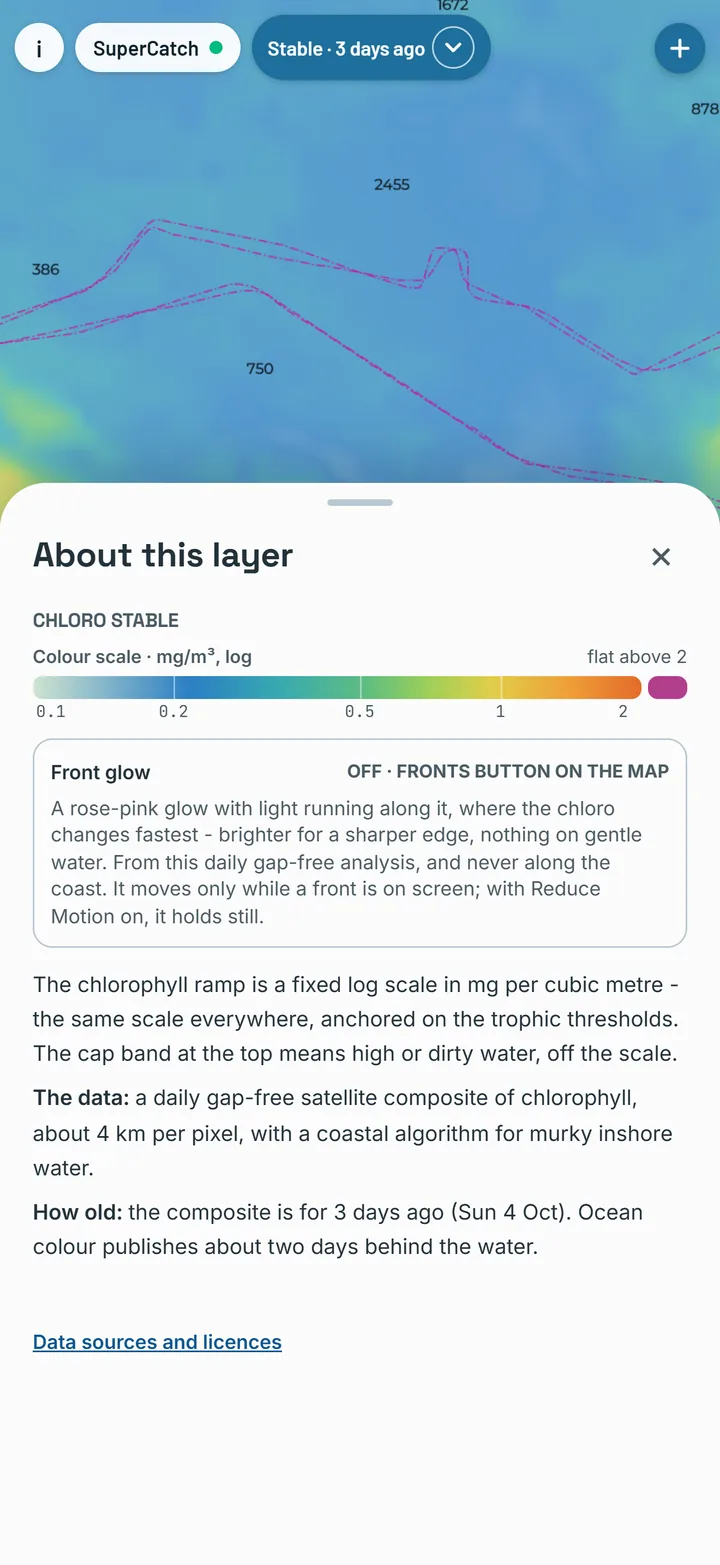
Every Chloro layer is ocean colour: sunlight coming back out of the sea, read in several visible bands. Phytoplankton shift the colour from blue towards green, and the balance between bands gives a chlorophyll concentration, drawn on a logarithmic scale because it spans orders of magnitude.

Chloro Day uses Sentinel-3's OLCI instrument, the sharpest ocean colour available day to day, with Himawari-9's daily picture filling between passes. Chloro Live is Himawari-9 alone. Chloro Stable is Copernicus Marine's multi-sensor 4 km product, whose chlorophyll uses a coastal algorithm built for mixed inshore water.

So Day gives you the sharp edge, Live gives you today's movement, and Stable gives you the whole coast with no gaps.

About this layer for chloro
About this layer, in the app.
Sea & wind

Whether it is worth going, and where it will be workable.

Swell, Wind and Current on the bottom strip. The forecast layers run forward on the slider, and the pill carries the lead - Forecast · +1 d. All three cover New Zealand, Australia and the Pacific east to 190°E (Fiji and Tonga).

Sea height

Copernicus Marine wave model · ~8 km · two days back to four days ahead, 3-hourly smoothed to hourly

What you see

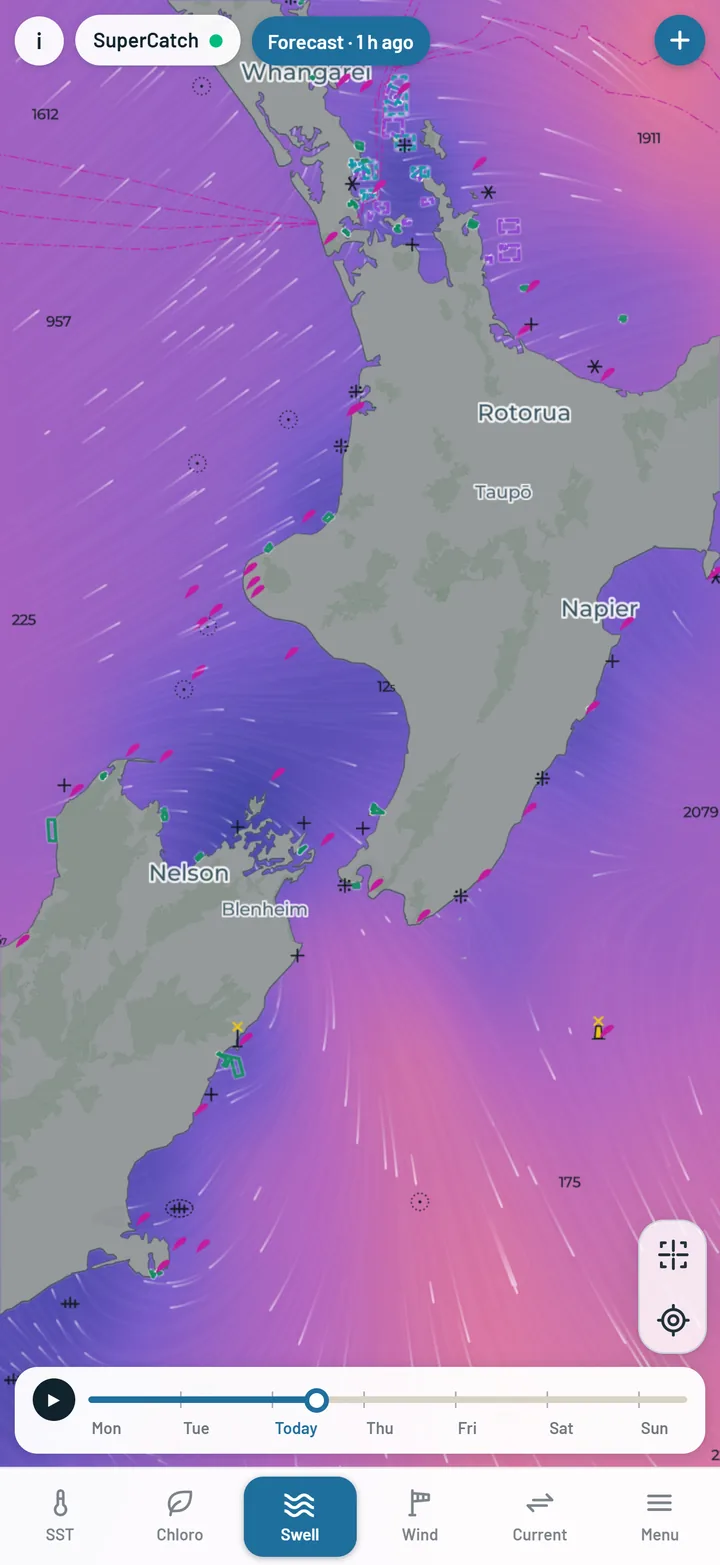
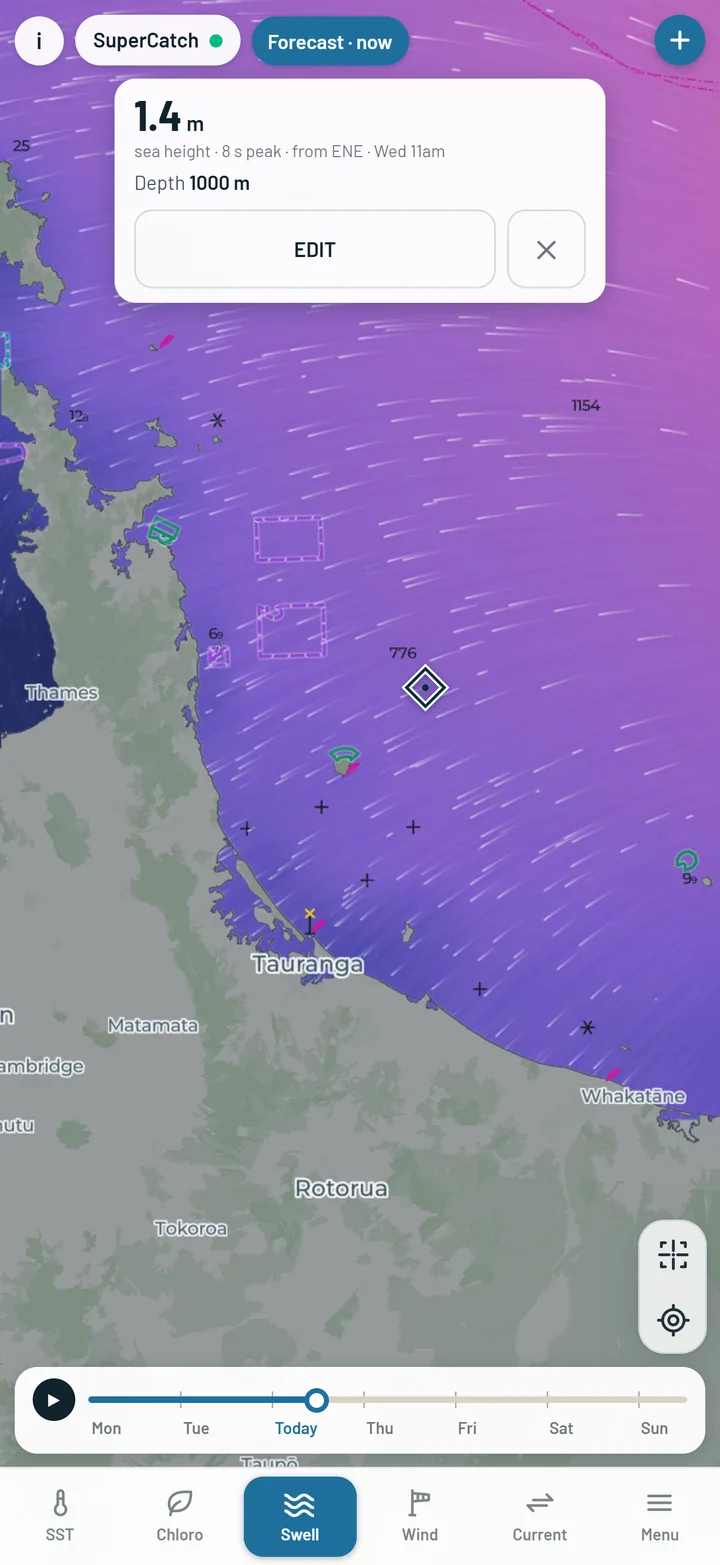
The Swell button paints Sea height: swell and wind chop together, in metres - the sea you will actually be in. Tap anywhere and the card gives the sea height there; MORE on the card gives the parts. Every catch you log records the sea height and the primary swell.

How old it can be

This is a forecast model, not a measurement, so there are no cloud gaps and no grey - the sea is covered everywhere. The forecast is refreshed every day.

How to use it

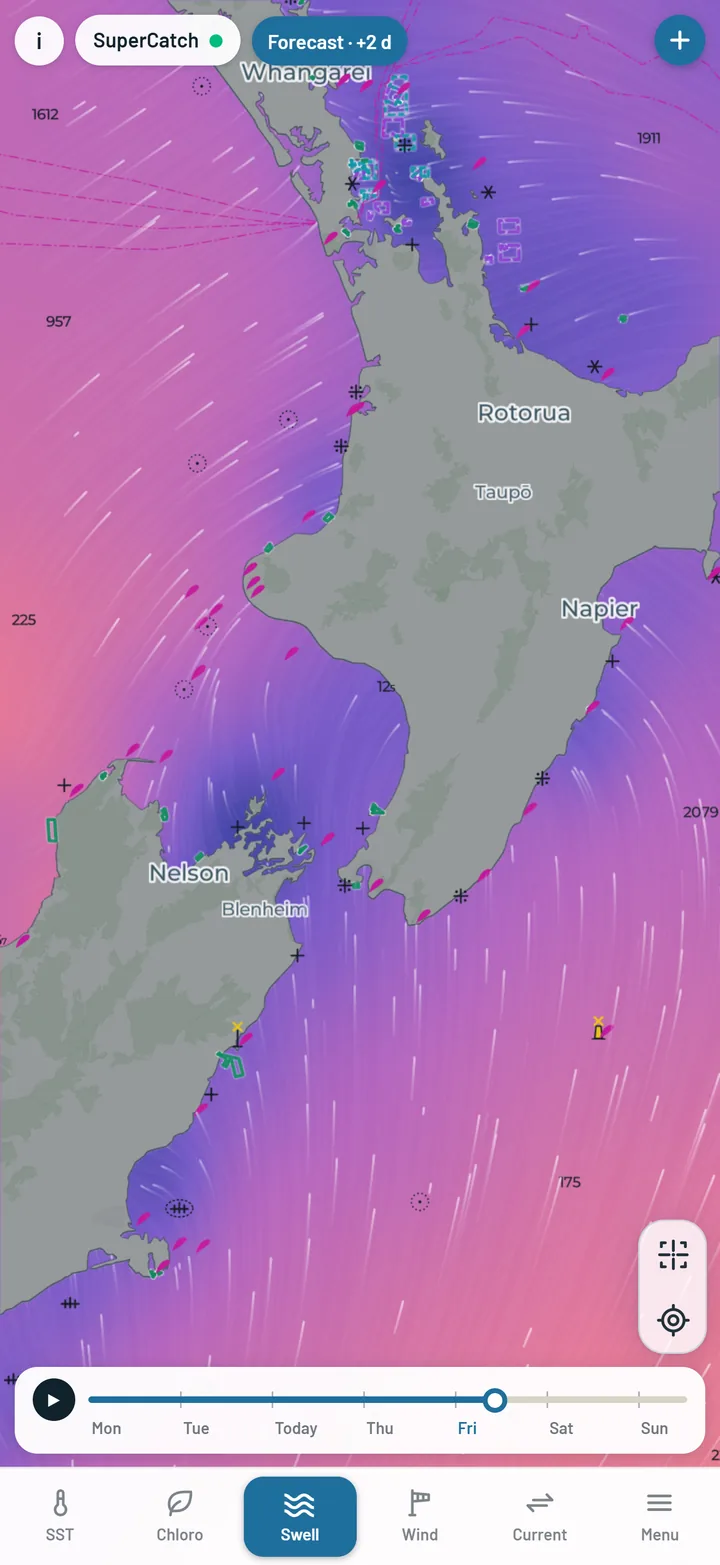
Drag the slider through the next four days to find the window, and back two days to see what the sea has been doing. Tap the water you plan to fish for the height right there.
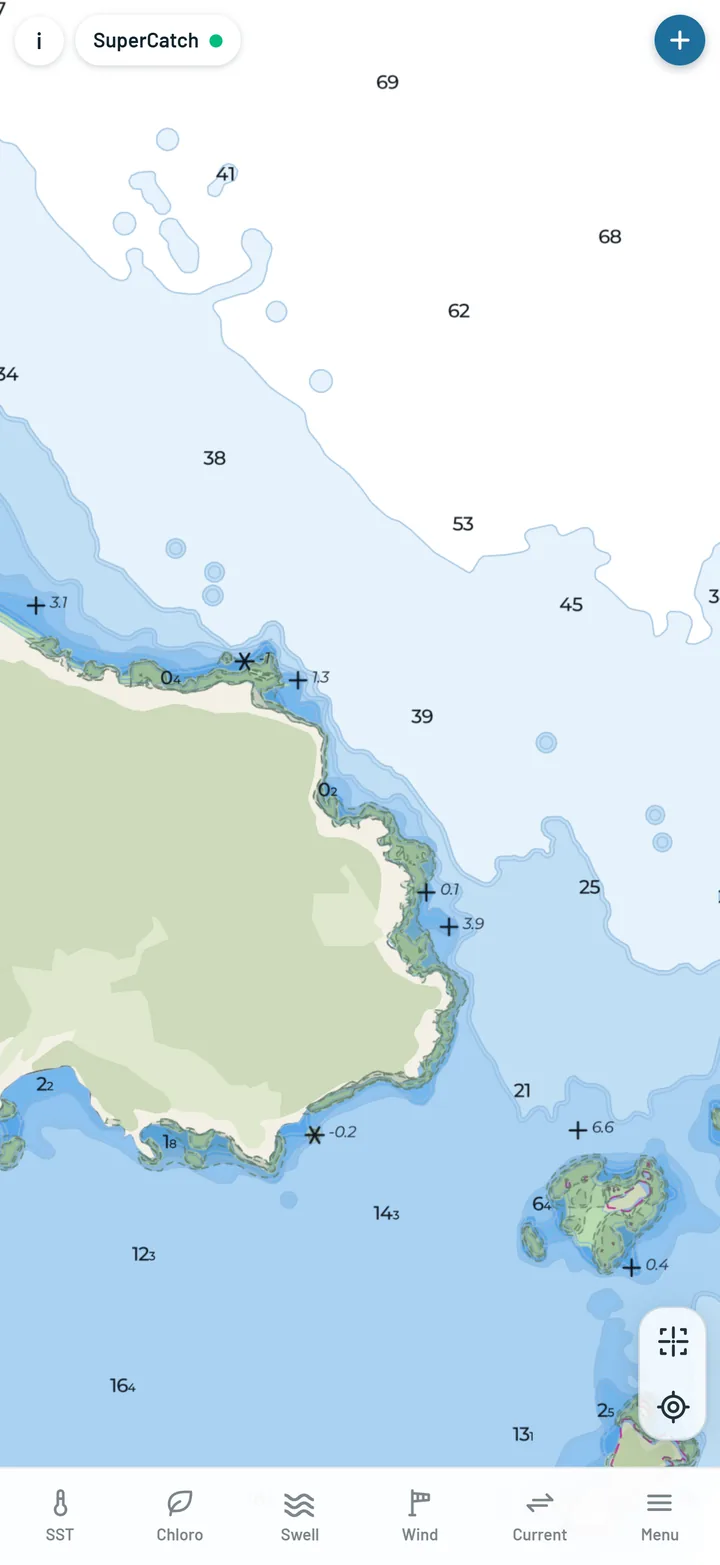
Sea height on the map
Sea height.
The reading card showing the sea height at a tapped spot
The sea height on tap.
The forecast slider on sea height
Four days ahead on the slider.

Wind and gusts

ECMWF Open Data · ~25 km close in, ~75 km zoomed out · now to four days ahead, four runs a day

What you see

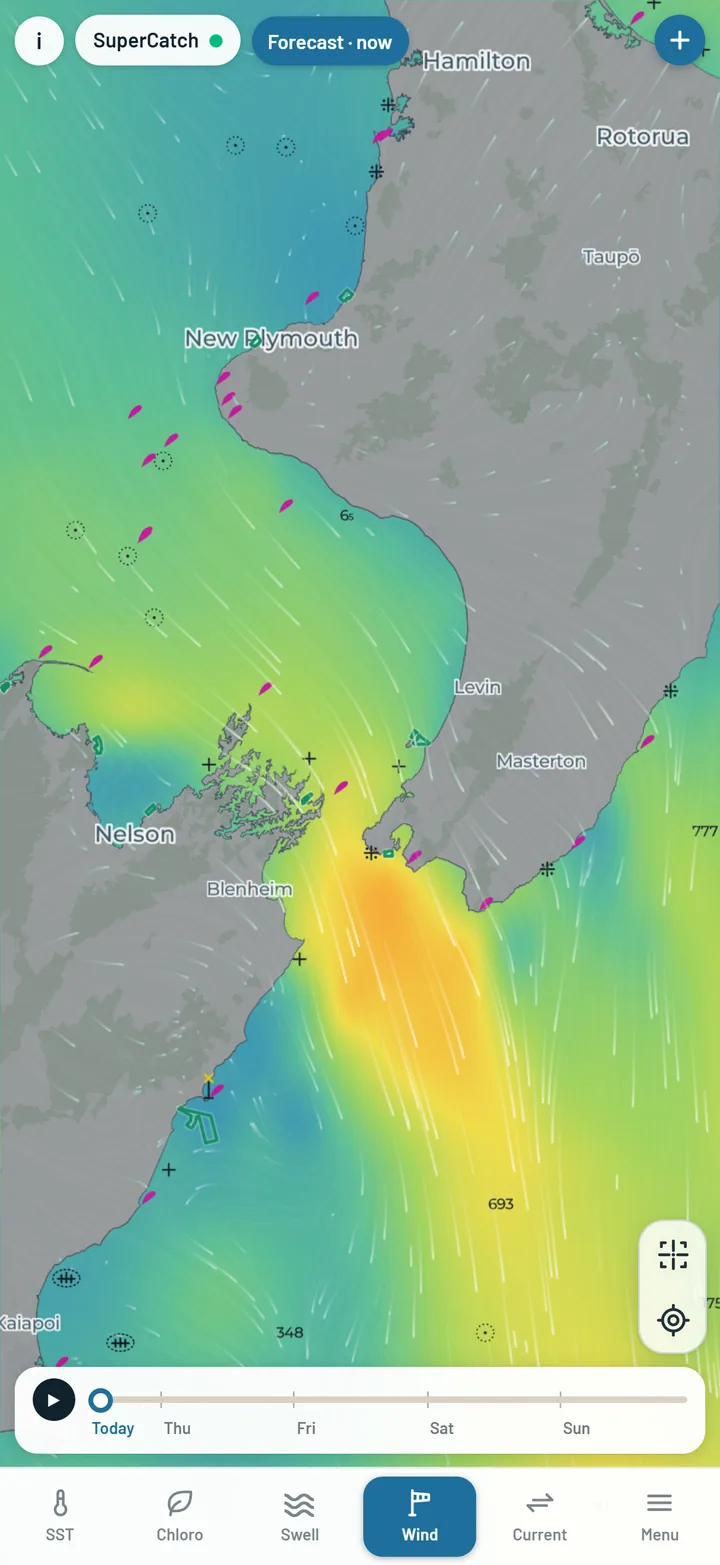
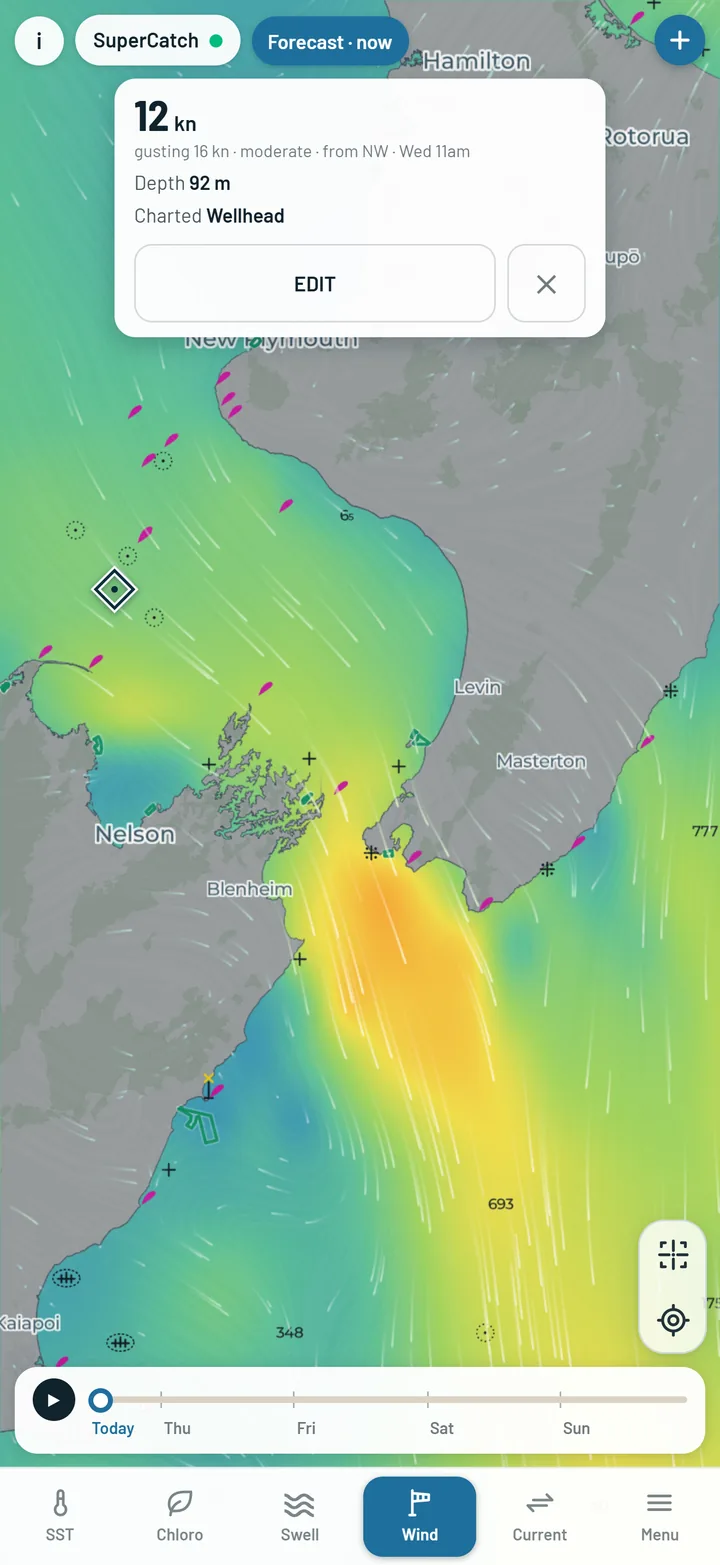
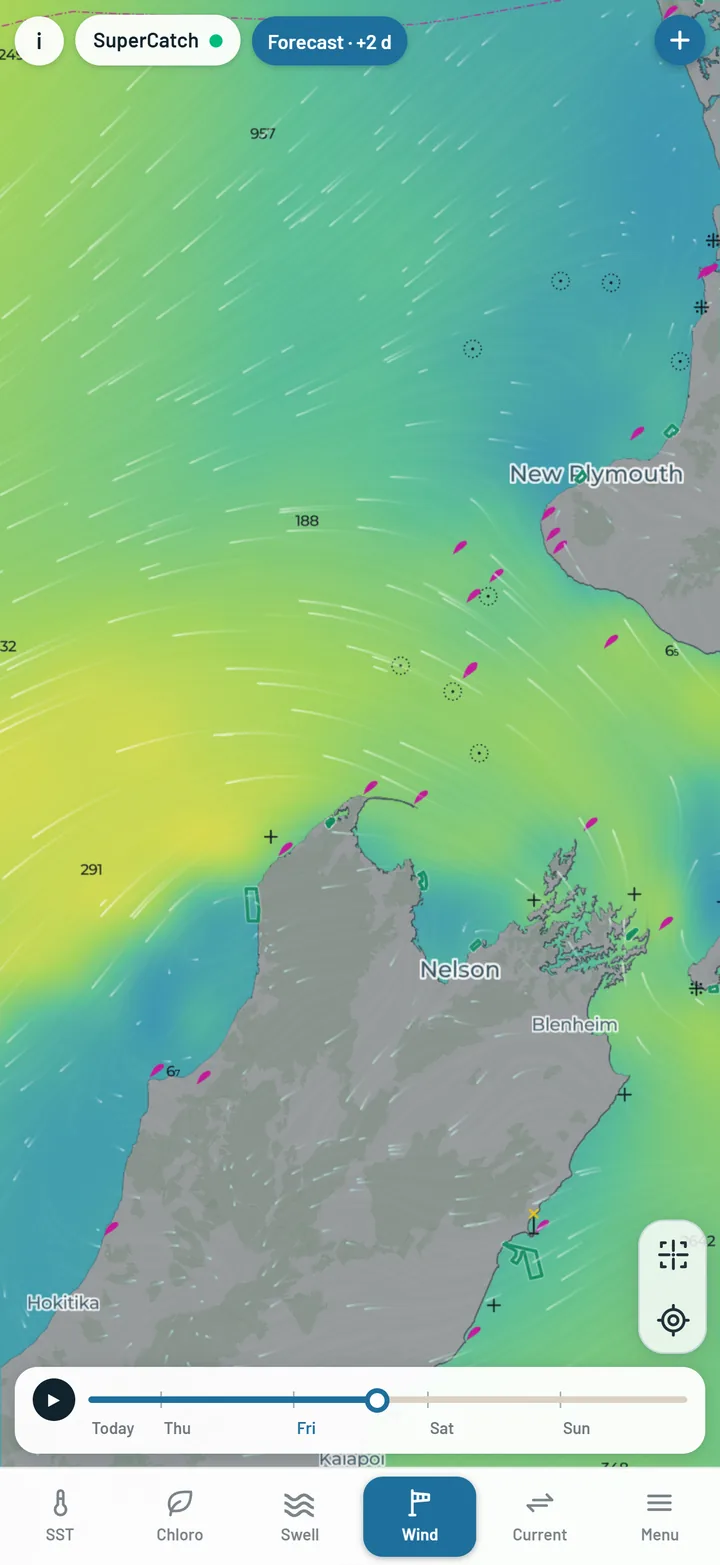
Mean wind speed in knots, with particles moving the way the wind blows. Tap for the card: the speed and what it is gusting - the number that matters in a small boat. When the mean wind at the map centre goes over 25 knots, the mode pill turns red.

How old it can be

Wind is forecast only - the slider runs from now to four days ahead, with no past hours. Zoomed out you see a coarser (~75 km) picture of the whole region; zoom in and the sharper ~25 km wind loads over it.

How to use it

Plan the day around the gusts, not the mean. Scroll the slider through the week, and watch the pill as you pan along the coast - a red pill is a quick signal to look closer. Every catch you log records the gust too.

Wind particles over the map
Wind, with particles.
The wind card showing the gust
Gusting, on the card.
The mode pill turned red for wind over 25 knots
Red pill: over 25 kn.

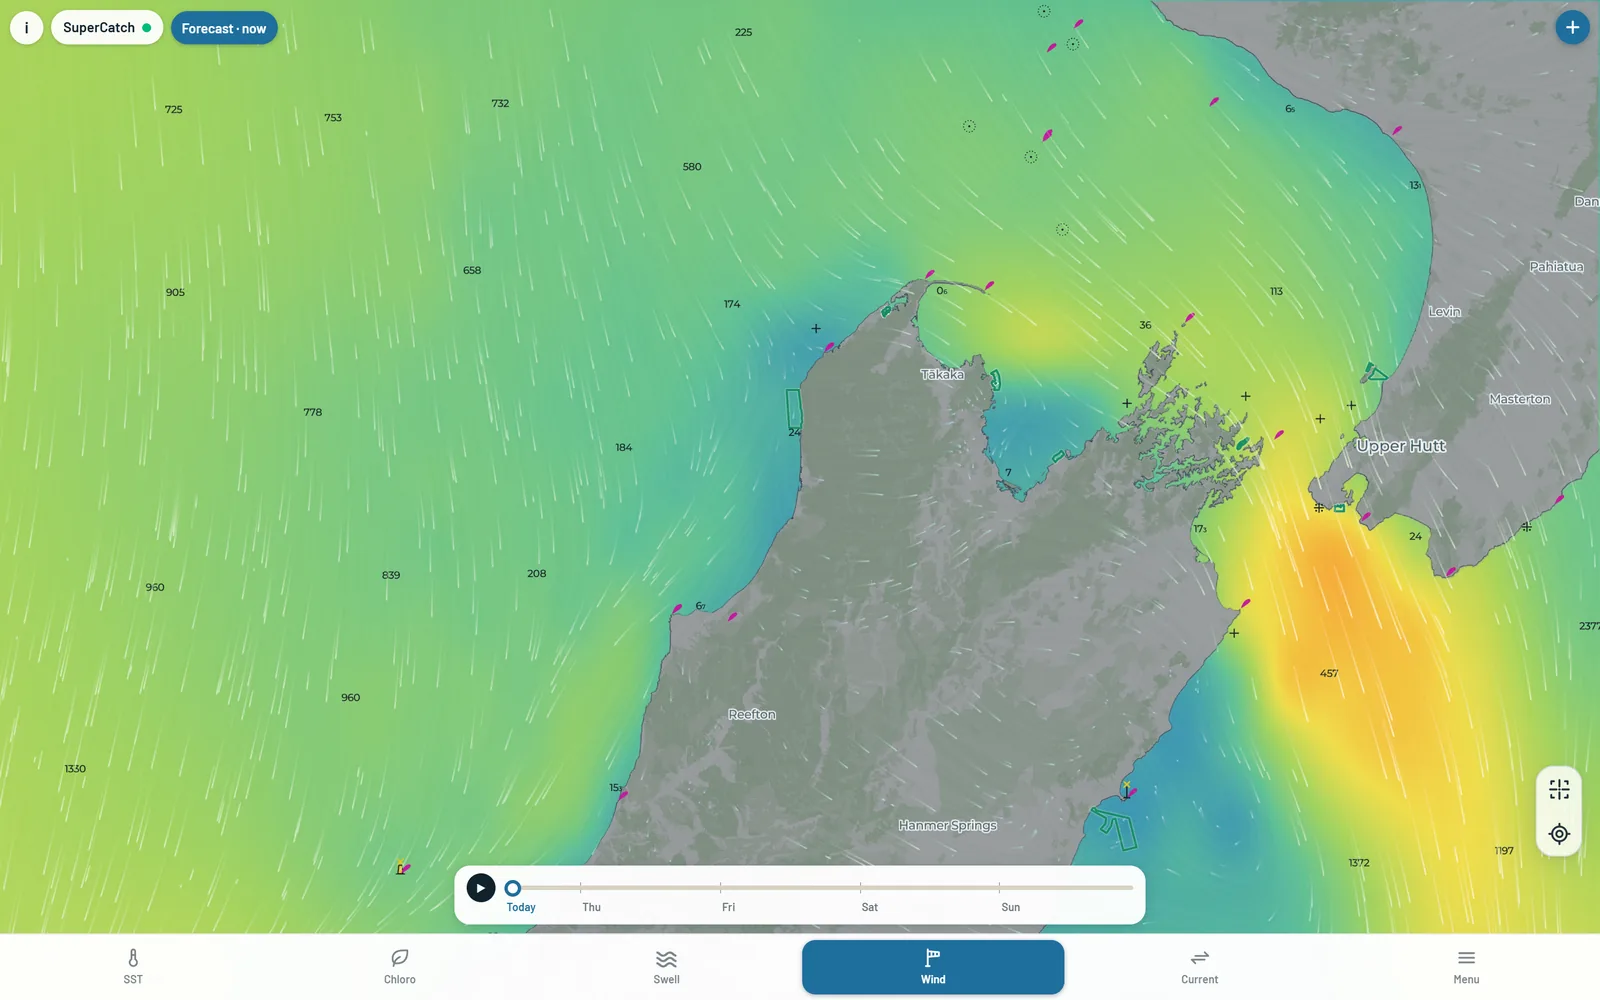
Wind on a bigger screen

Wind particles on a desktop screen

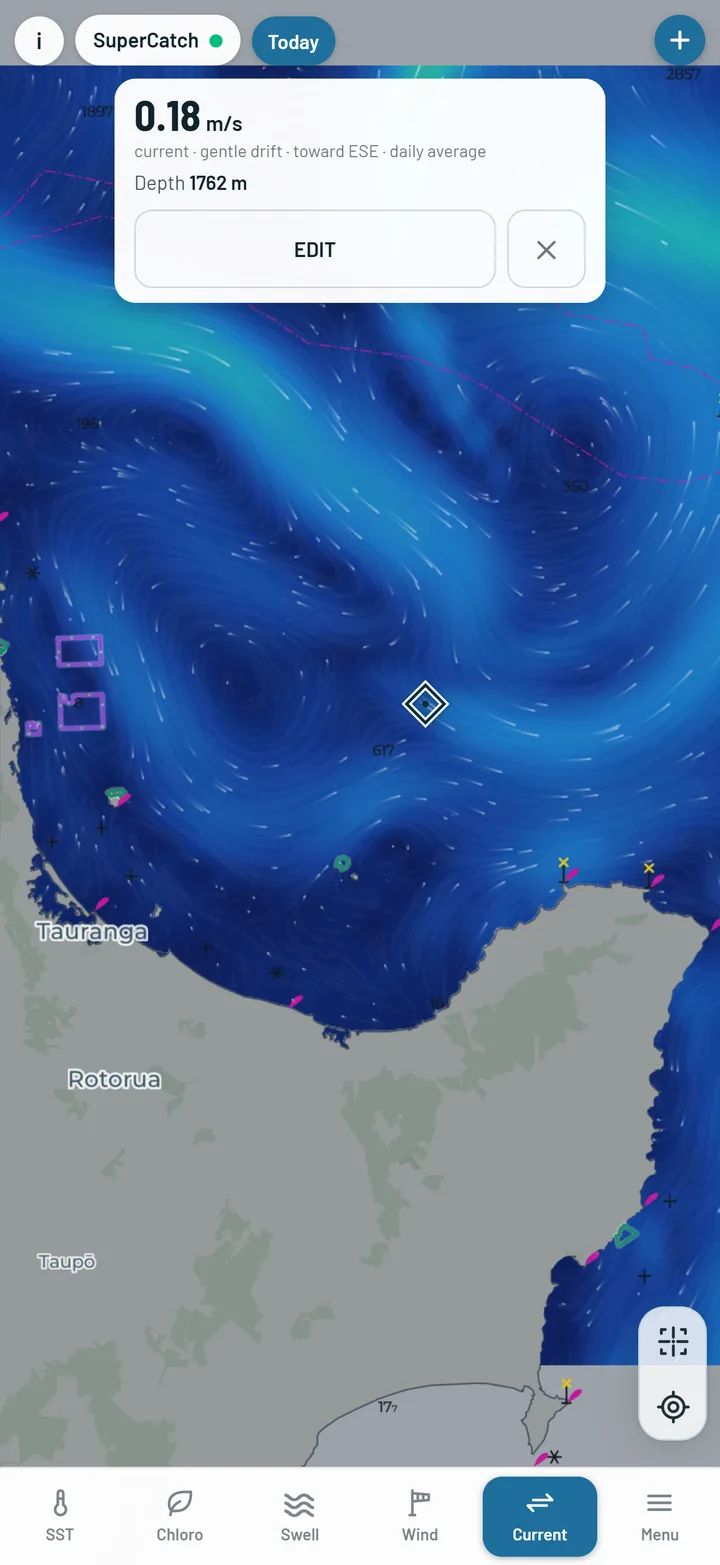
Current

Copernicus Marine · surface current, ~8 km · one picture a day, two days back to four days ahead

What you see

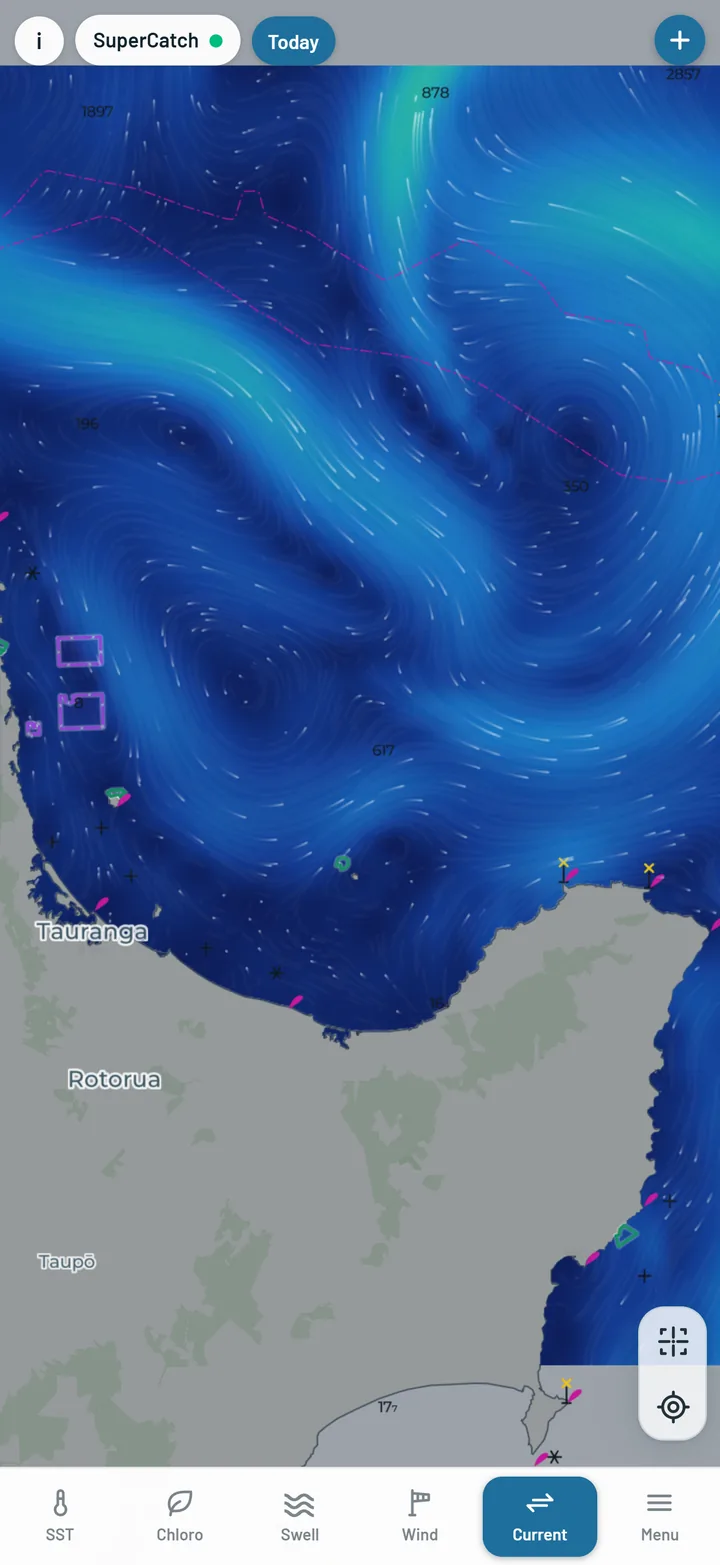
The surface current over the whole map, one picture for each day. Tap for the speed and direction at any point.

How old it can be

The past days are the model's analysis, the days ahead are its forecast. Each is a daily average, so it shows the steady drift, not the tide turning hour by hour.

How to use it

Read it for the big drift: where the warm current is running, which way an eddy is turning, and how it will carry a drift or a spread of lures.

Surface current on the map
Surface current.
The current card
The reading on tap.

What it is measured from

Models, not observations

Sea height and its parts come from Copernicus Marine's global wave model on a 3-hourly step, smoothed to the hourly slider. Wind comes from ECMWF's open forecast, run four times a day. The current is Copernicus Marine's surface current analysis. These are forecasts and analyses at regional scale - about 8 km and 25 km - so they show the pattern across a coast; your own eyes and instruments take it from there.
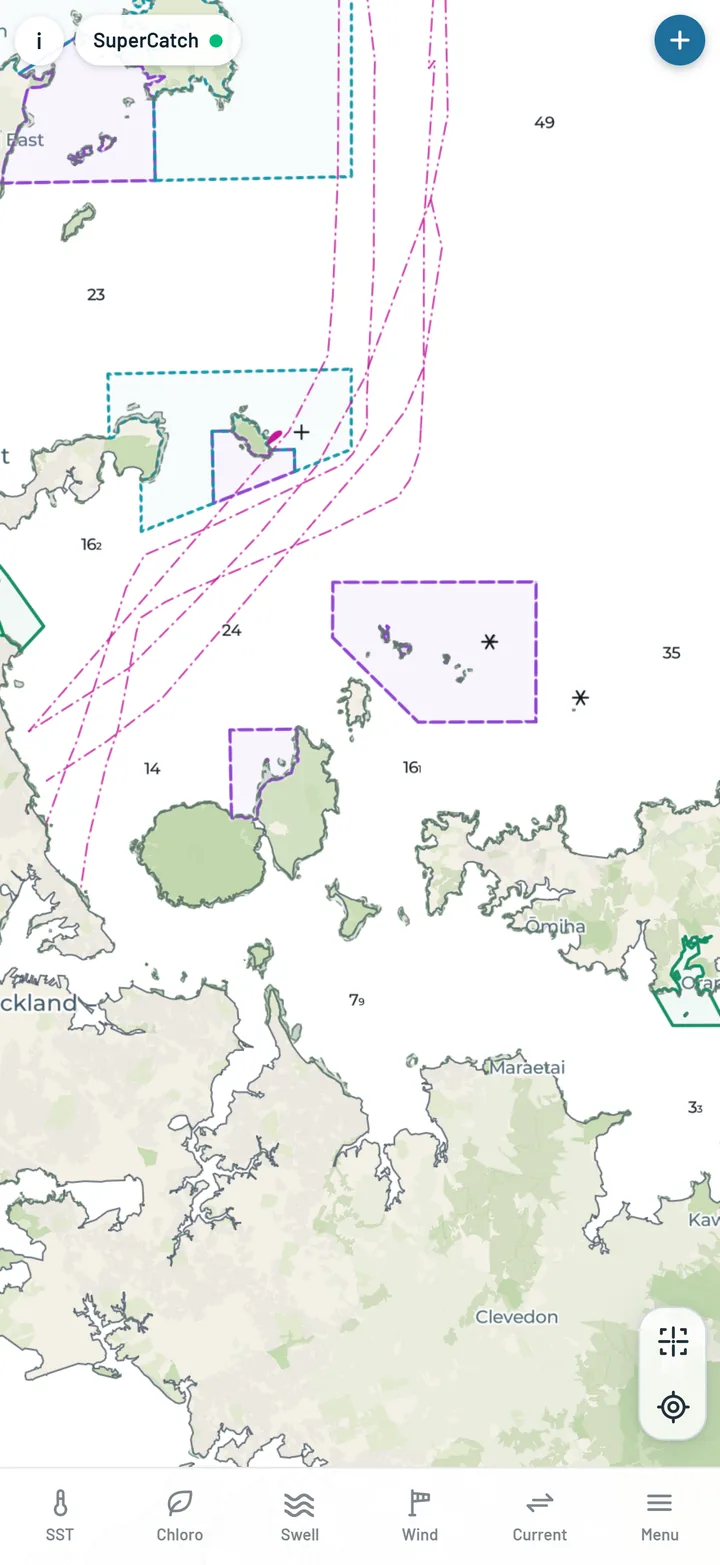
So sea height tells you what the water will feel like, the gust tells you whether you want to be on it, and the current tells you which way it is all moving.

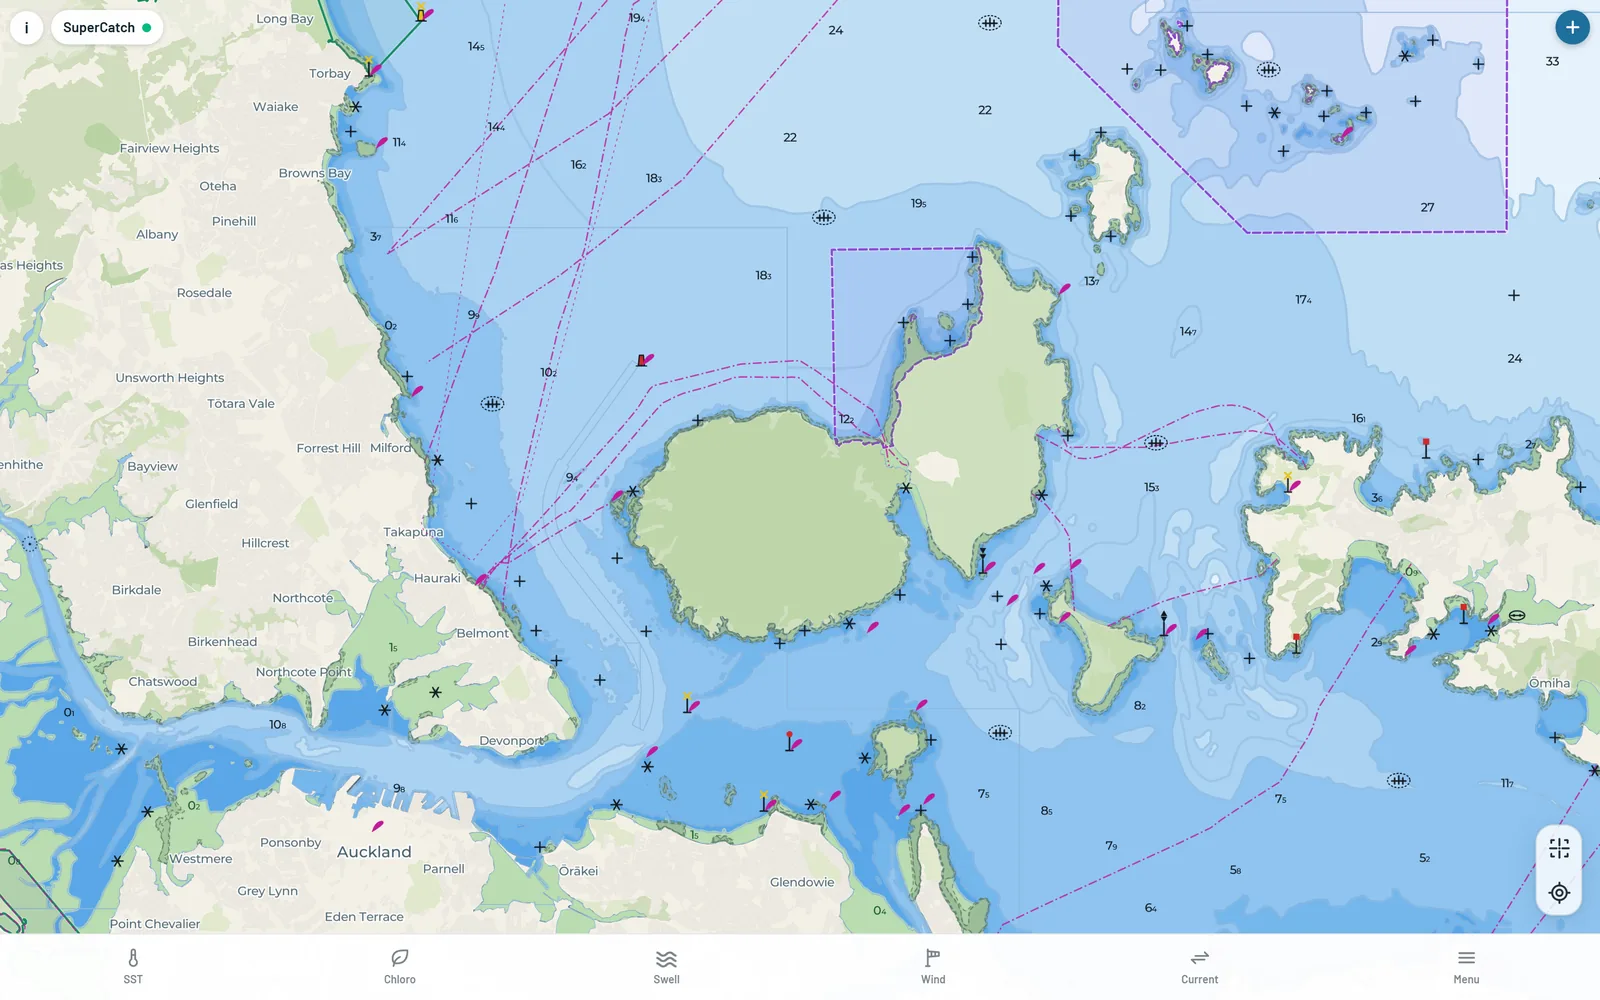
The chart

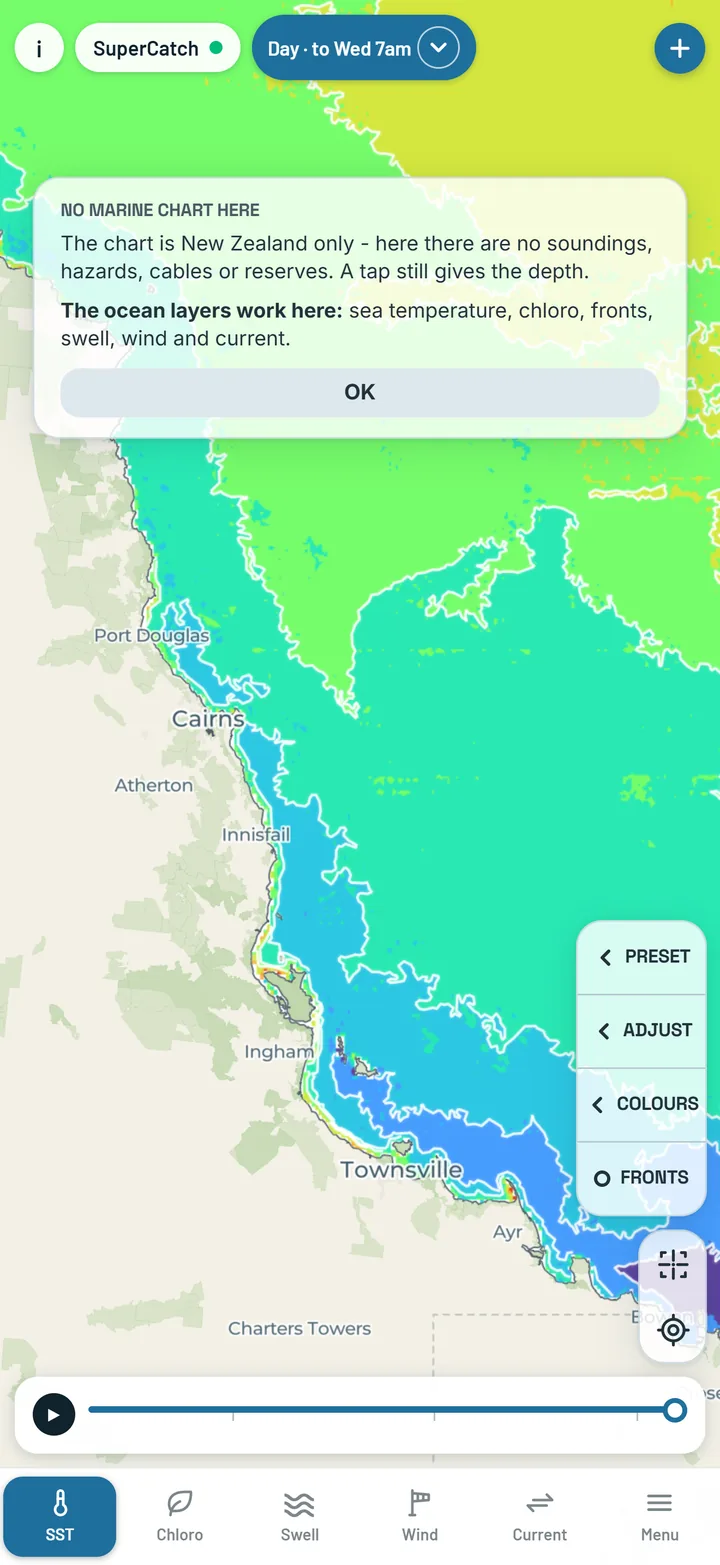
A marine chart under every layer - in New Zealand.

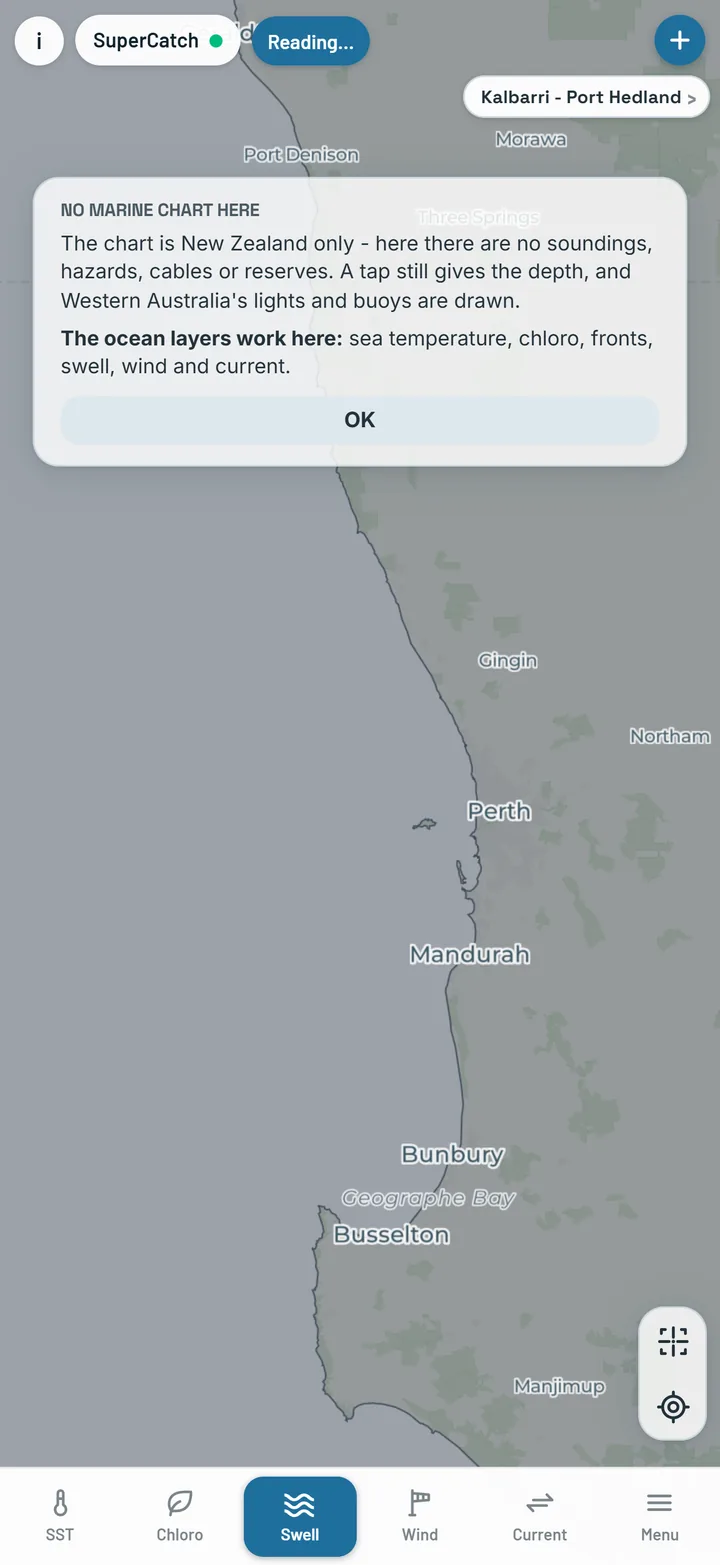
Turn every layer off and there is still a chart: depth, hazards, reserves, cables, club water and your own marks. It is the part you plan against. The chart is New Zealand only - the charted depths and coastline come from LINZ, which covers New Zealand waters and nothing else. In Australia and the Pacific there is no marine chart.

The SuperCatch chart on a desktop screen

Depth: contours, soundings and bands

LINZ charts inshore, NIWA from 100 m down · NESP, GEBCO and Transport WA in Australian waters

What you see

Spot soundings and chart hazards are always drawn. The Depth bands switch in the Menu turns the depth shading and the depth contours on and off together; it starts off, so a new map is clean water with soundings. Contours come from the LINZ charts inshore and from NIWA's seabed survey from 100 m down, and are New Zealand only.

In Australian waters a tap gives the depth (from NESP, GEBCO, and Transport WA's 5 m survey inshore in Western Australia), and Western Australia's lights and buoys are drawn.

How to use it

Turn Depth bands on, find the ledges, pinnacles and shelf breaks, then lay a temperature or chloro layer over them. Every tap on the map gives the depth at that point - shown as "…" for a moment while it is worked out, or "Unavailable" with the reason if there is no depth to give.

Contours and soundings
Contours and soundings.
Depth bands off
Depth bands off.
Depth bands on
Depth bands on.

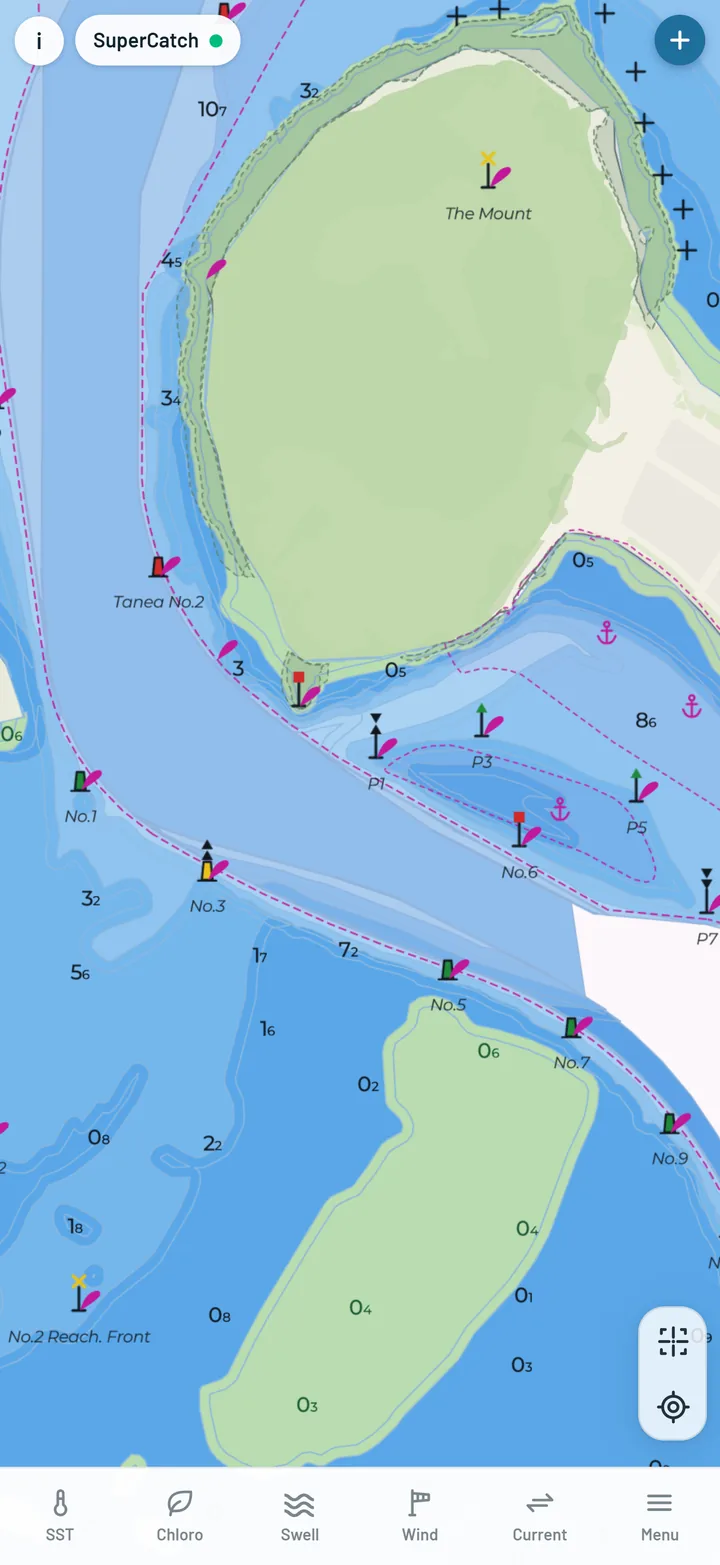
Hazards, seabed and cables

What you see

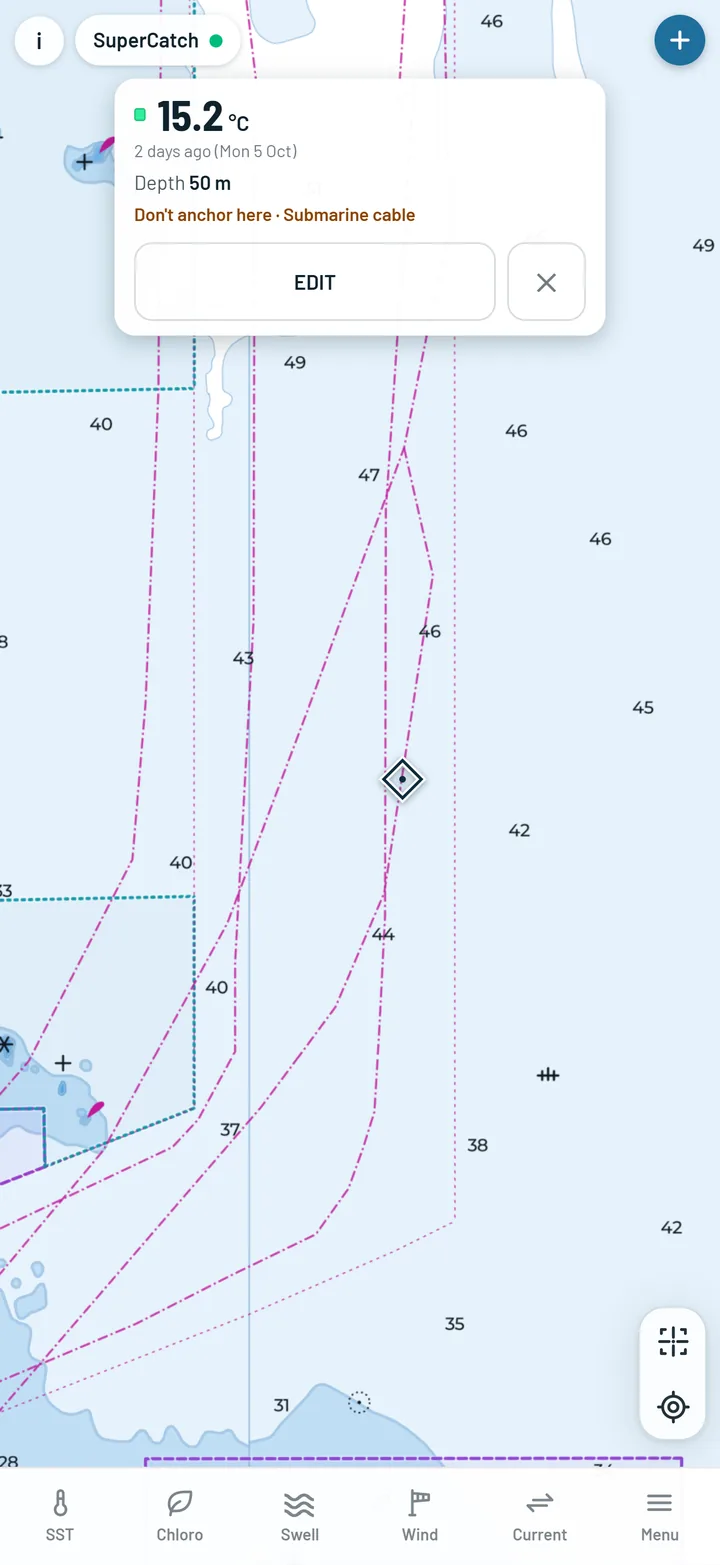
Chart hazards are always drawn: rocks, wrecks, obstructions, lights and buoys, in the standard INT-1 symbols you know from paper charts. Seabed type is a menu toggle that marks sand, mud, rock and the rest. Submarine cables are drawn, and a tap on one says so on the card.

How to use it

Seabed type is where reef fish and bottom species live - rock beside sand is an edge on the bottom. Wrecks and obstructions are structure. And the card tells you when you are over a cable before you drop the anchor.

Chart hazards in INT-1 symbols
Hazards in INT-1 symbols.
Seabed type on the chart
Seabed type.
A submarine cable tapped
A cable, tapped.

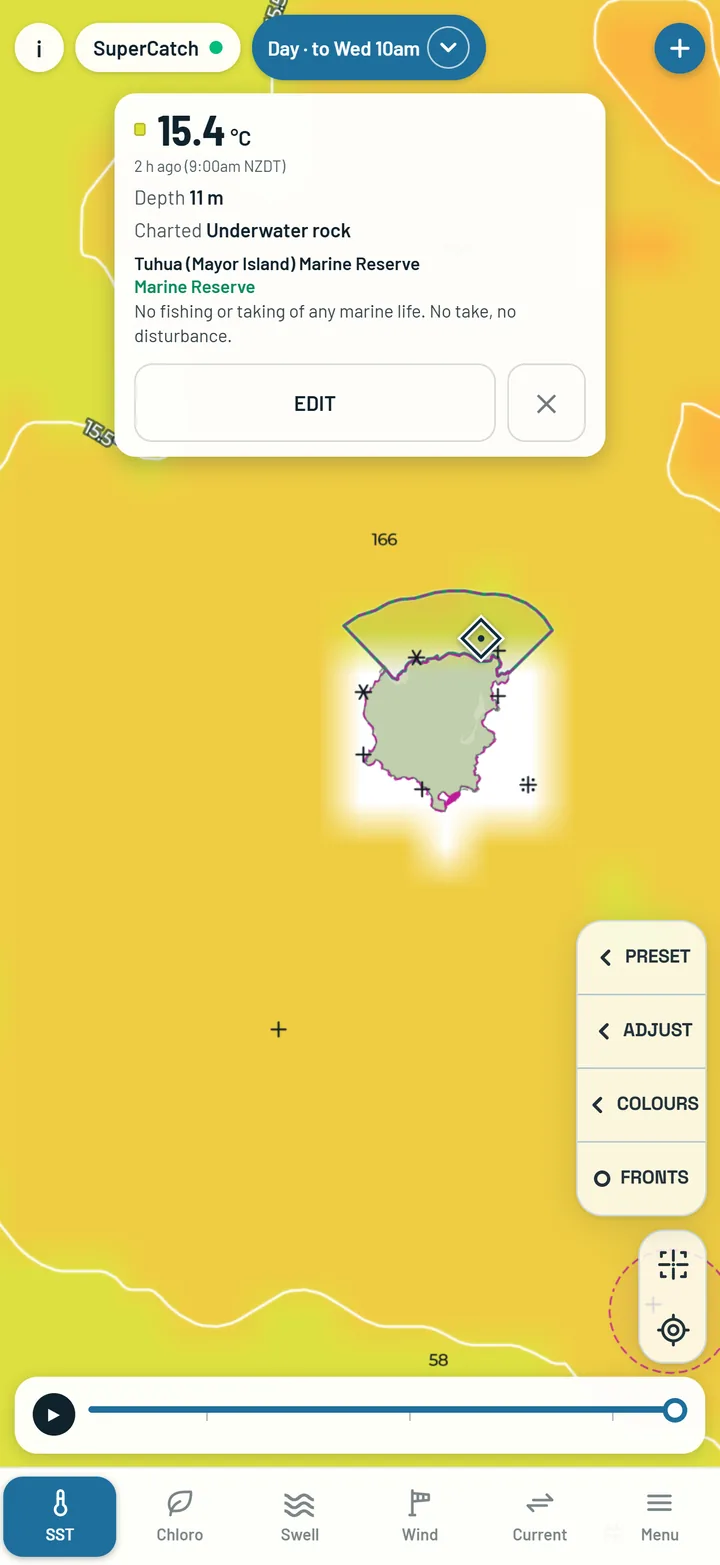
Marine reserves and protected areas

What you see

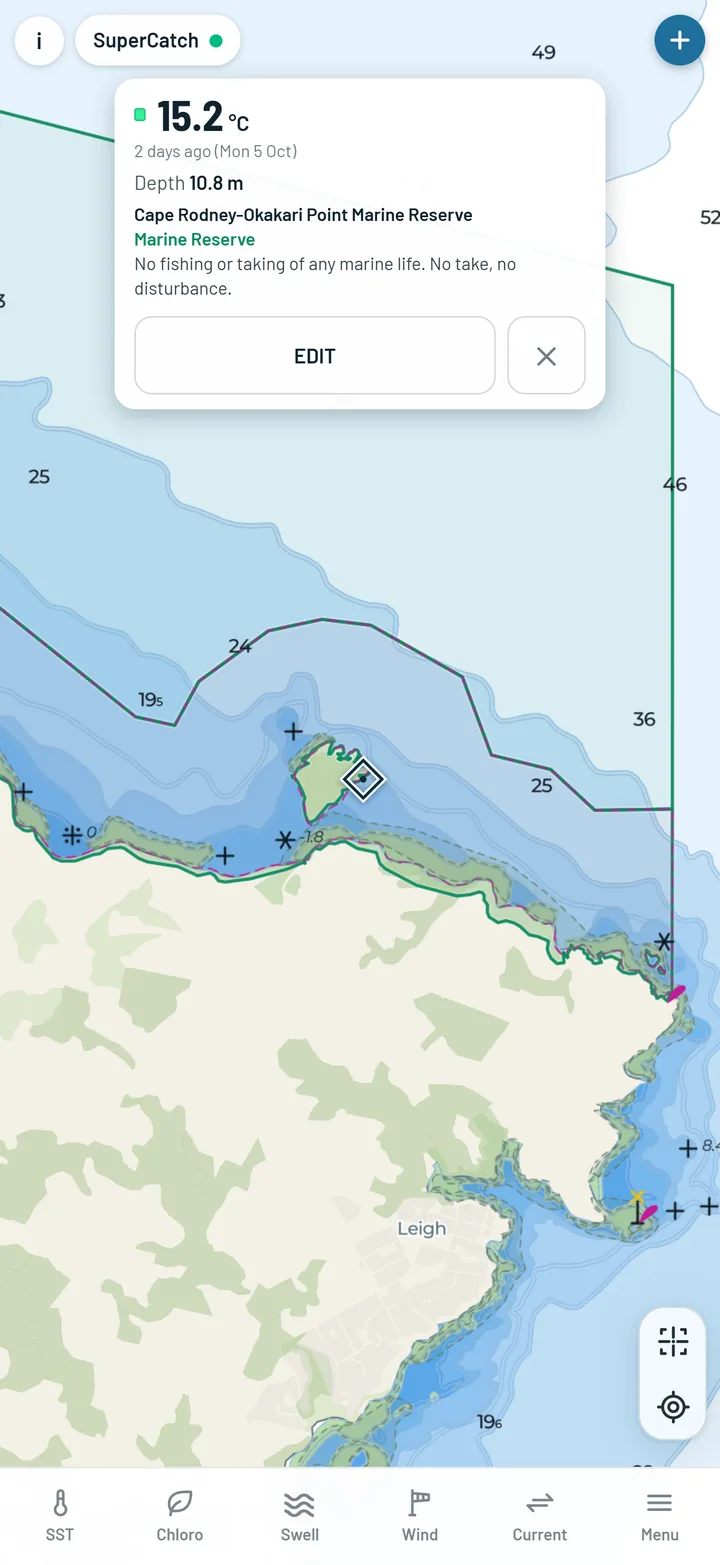
In New Zealand, Marine Reserves, High Protection Areas and Seafloor Protection Areas are drawn on the chart. Tap inside one and the card leads with its name, its type and its rules. Protected areas are not drawn outside New Zealand.

How to use it

See a boundary before you cross it. The rules shown are a guide - the regulation itself is the authority.

A marine reserve with its rules on the card
A reserve and its rules.

The reading card

What you see

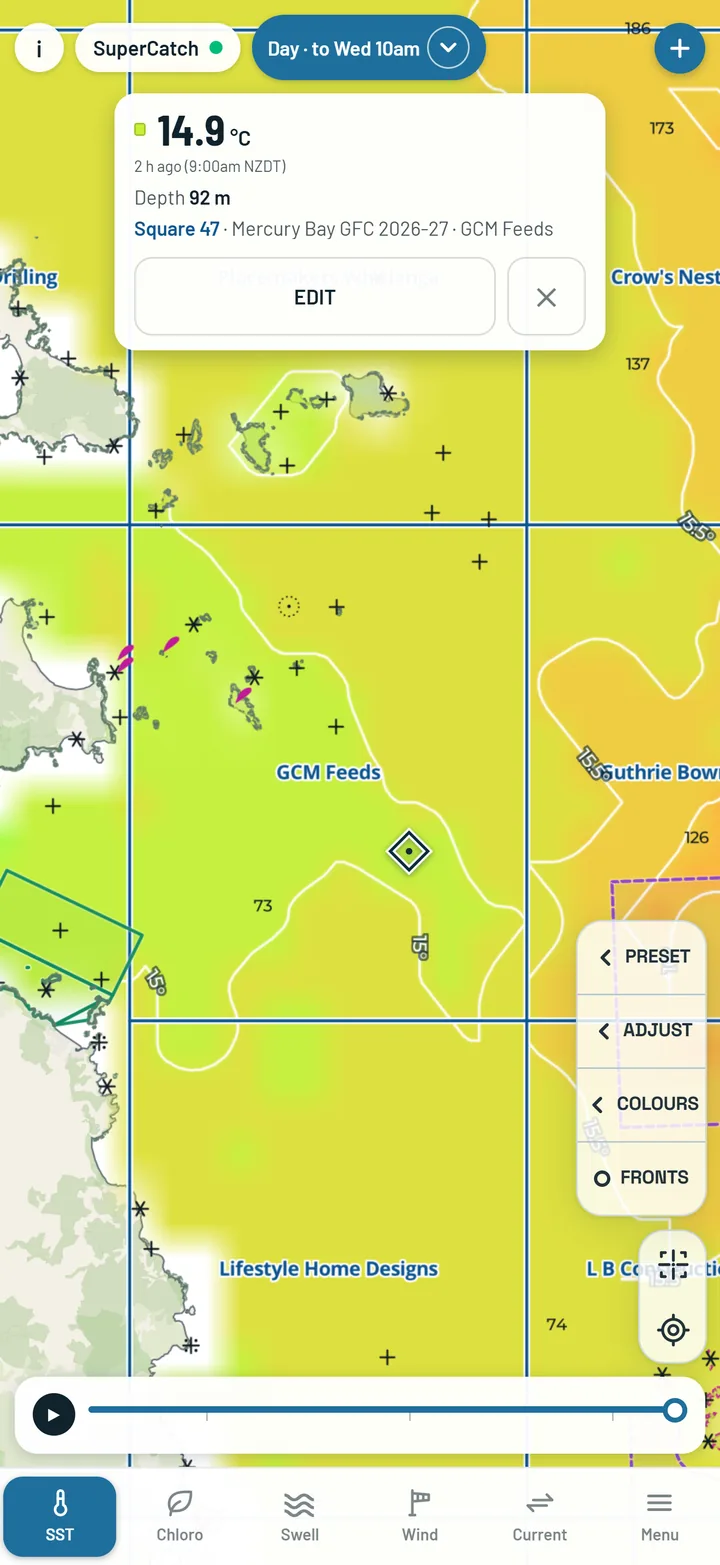
Tap anywhere on the map. The card always shows the layer's own reading, the depth, the club square, and what is charted there - a reserve, a cable, a hazard. A reading still on its way shows "…"; one the app cannot give shows "Unavailable" with the reason - it never guesses.

How to use it

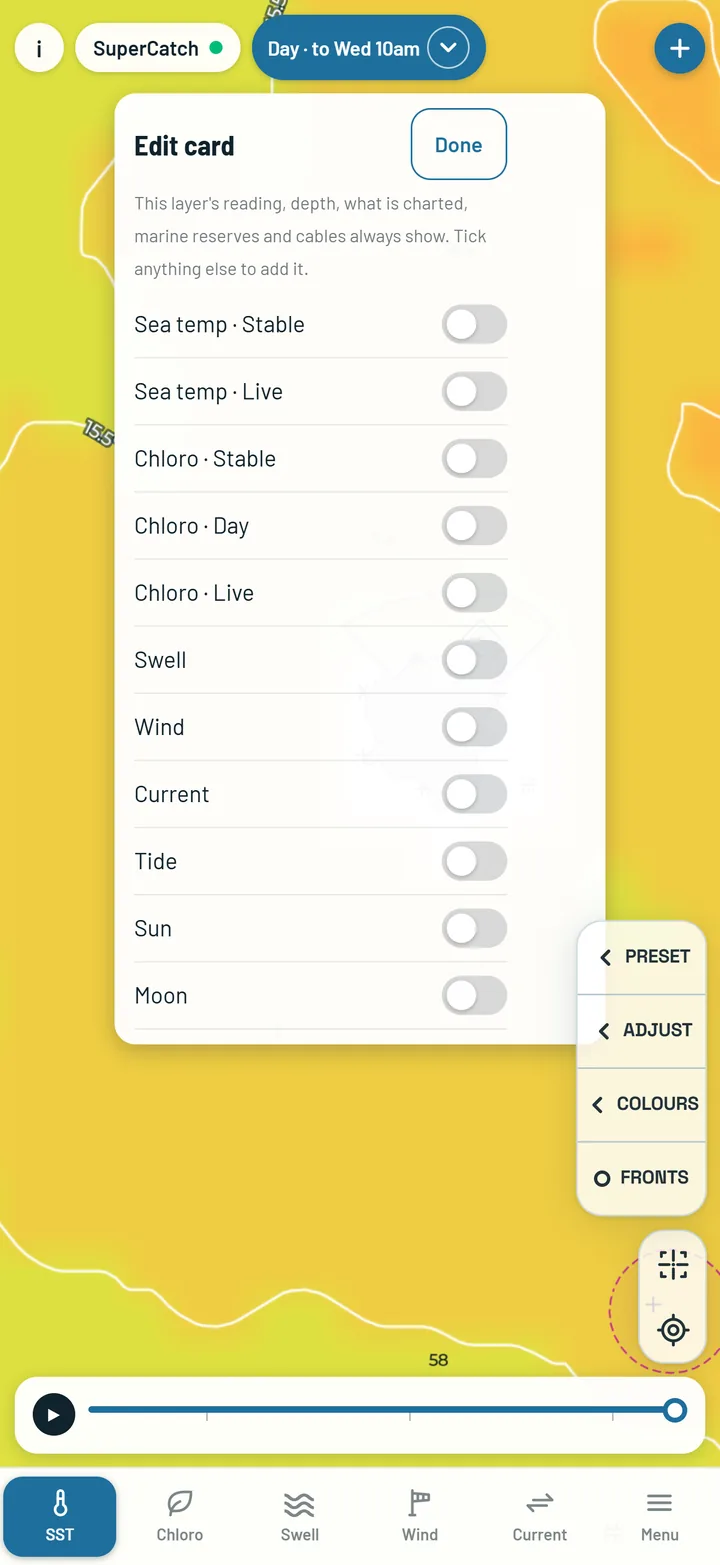
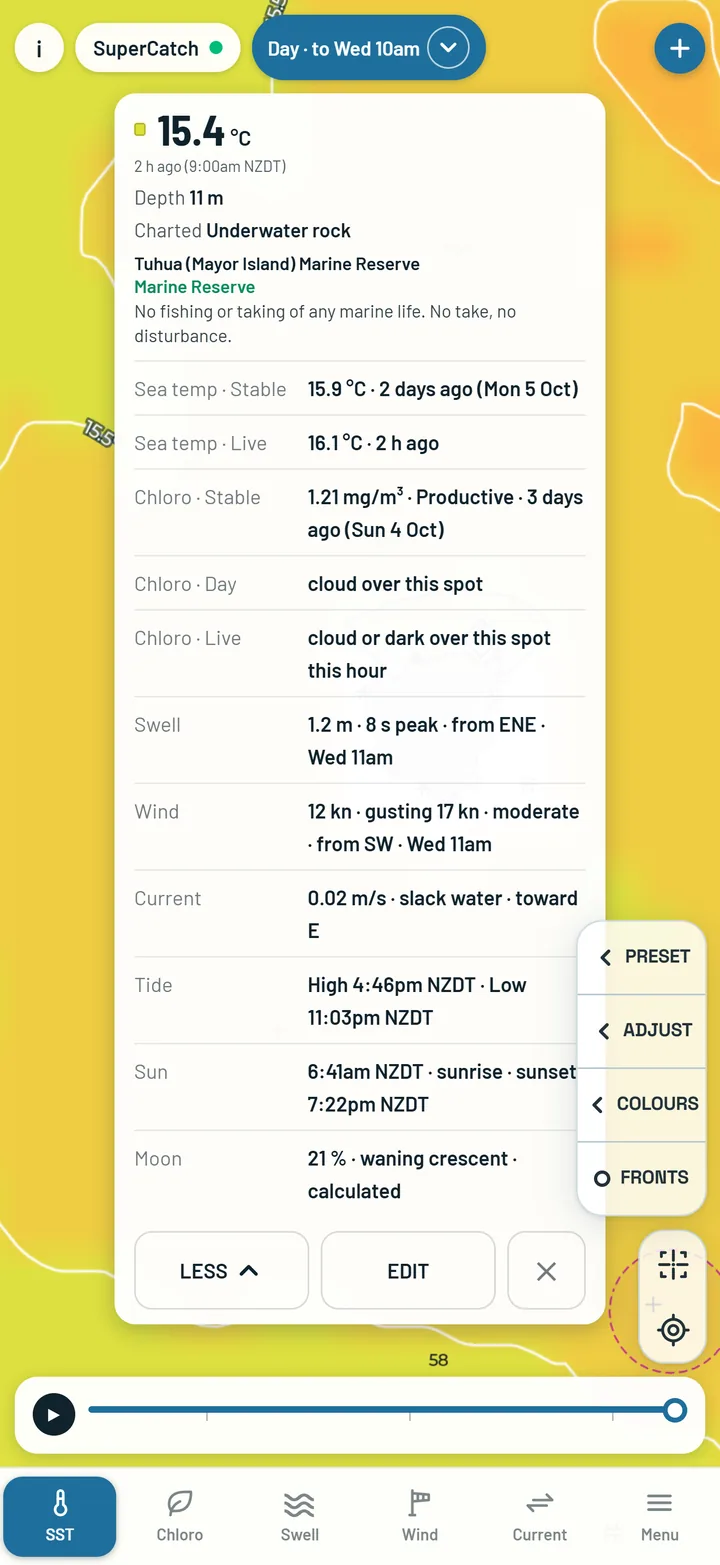
Tap the card to open it, then EDIT. There are 12 switches: every version of sea temperature and chloro (Stable, Day and Live), swell, wind, current, tide, sun and moon. They all start off, and the layer you are already on is left out because it is on the card anyway. What you tick waits behind MORE on every tap, so the card stays small until you ask.

The reading card
One tap.
The card's EDIT switches
EDIT.
The card with every reading switched on
Everything on.

Tides

LINZ published tide times · New Zealand only · 2025 to 2029

Switch Tide on in the card's EDIT and every tap gives the tide from the nearest New Zealand port within 200 km, using LINZ's published high and low water times, with a curve drawn between them. The main ports give heights as well as times; smaller ports give times only. Outside New Zealand, or more than 200 km from a port, there is no tide. This is not an official tide table, so check an official table before you cross a bar.

Club grids

What you see

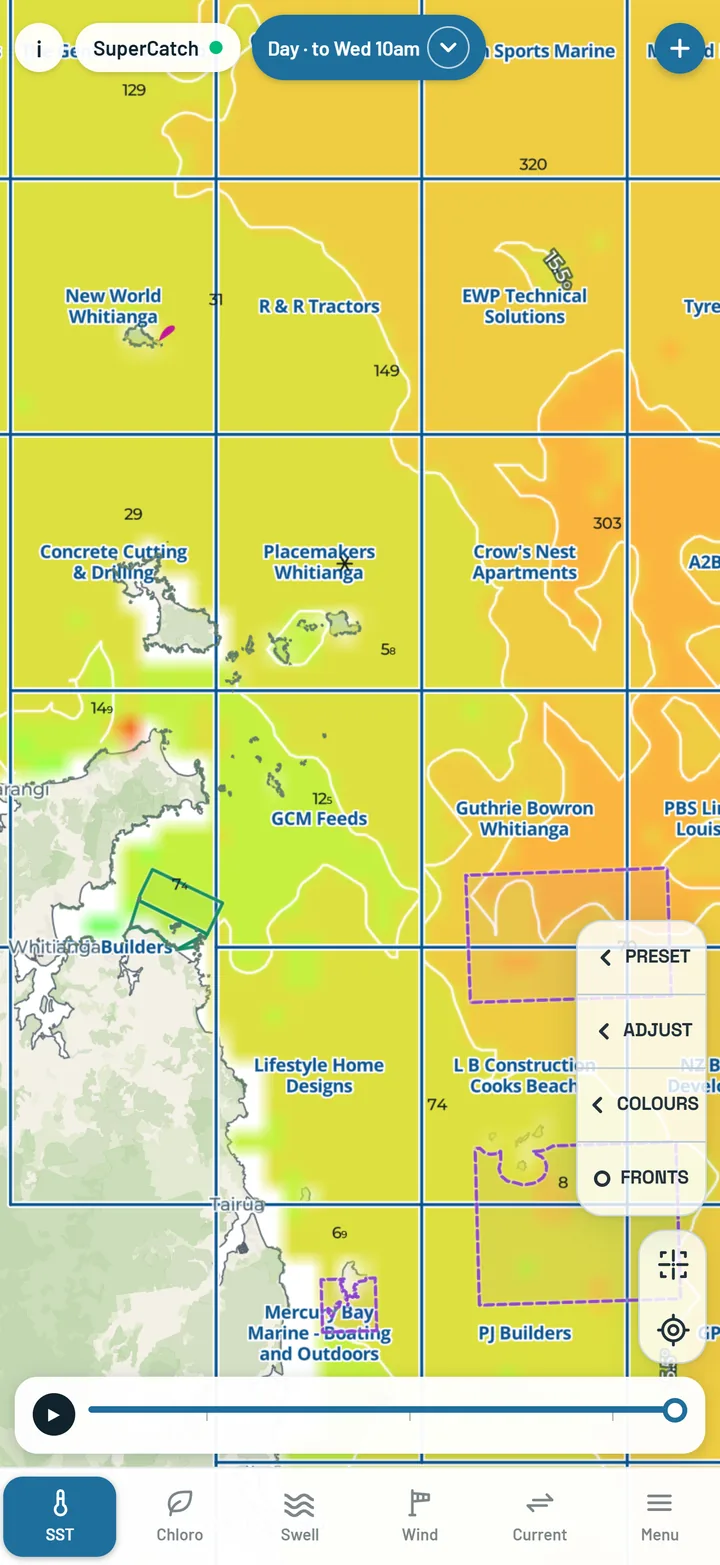
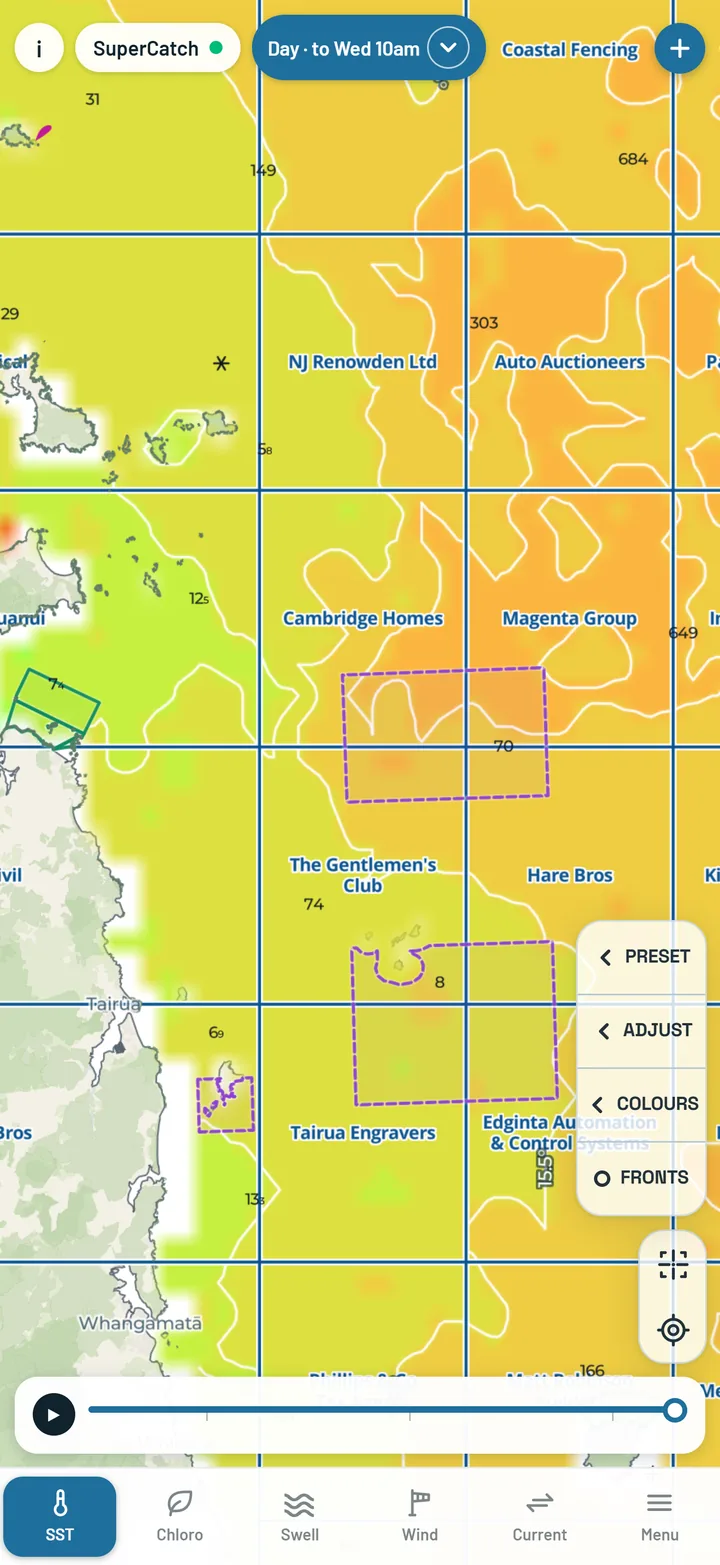
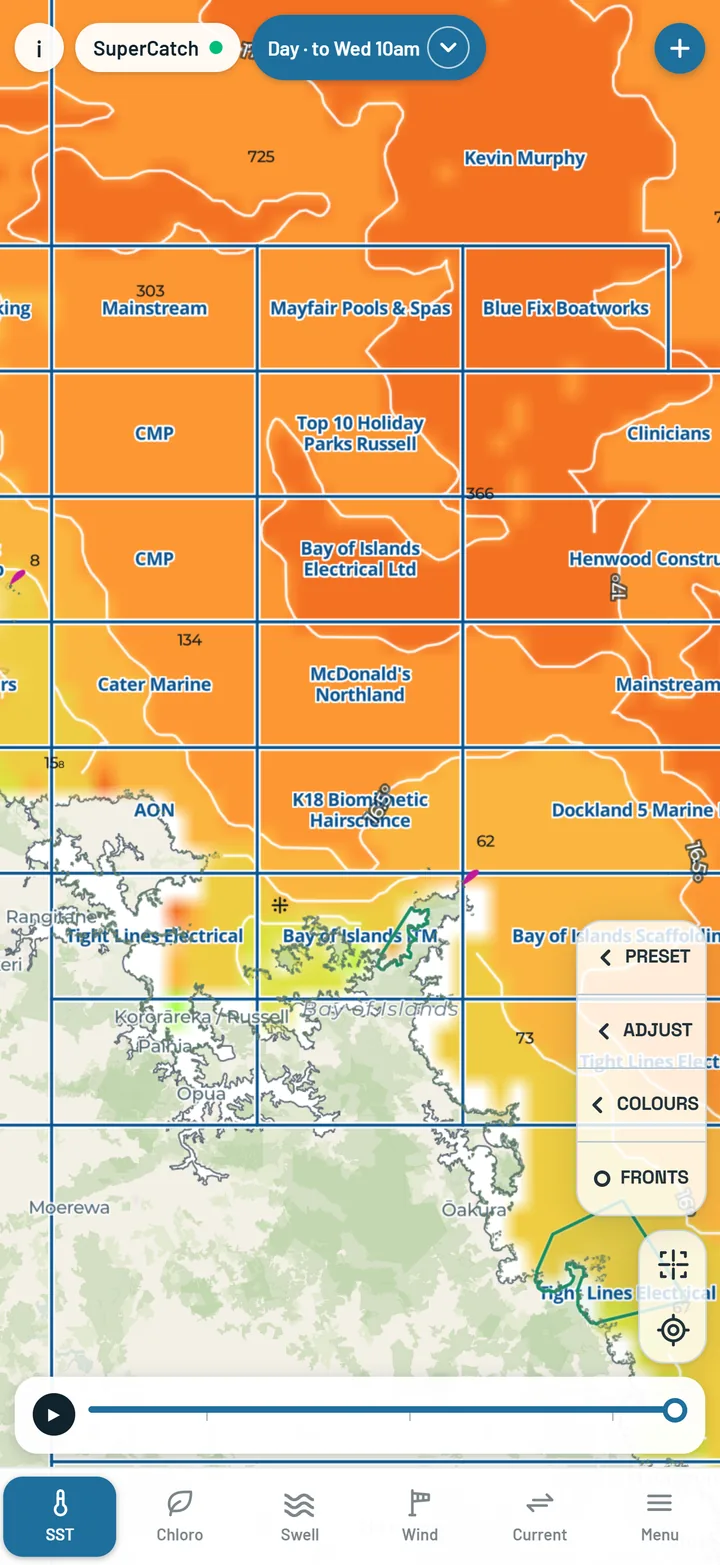
Three club grids: Mercury Bay Game Fishing Club 2026-27, Tairua Pauanui Sports Fishing Club 2026-27 and Bay of Islands Swordfish Club 2026. Each square is labelled with its sponsor's name, and the chip shows the square at the map centre.

How to use it

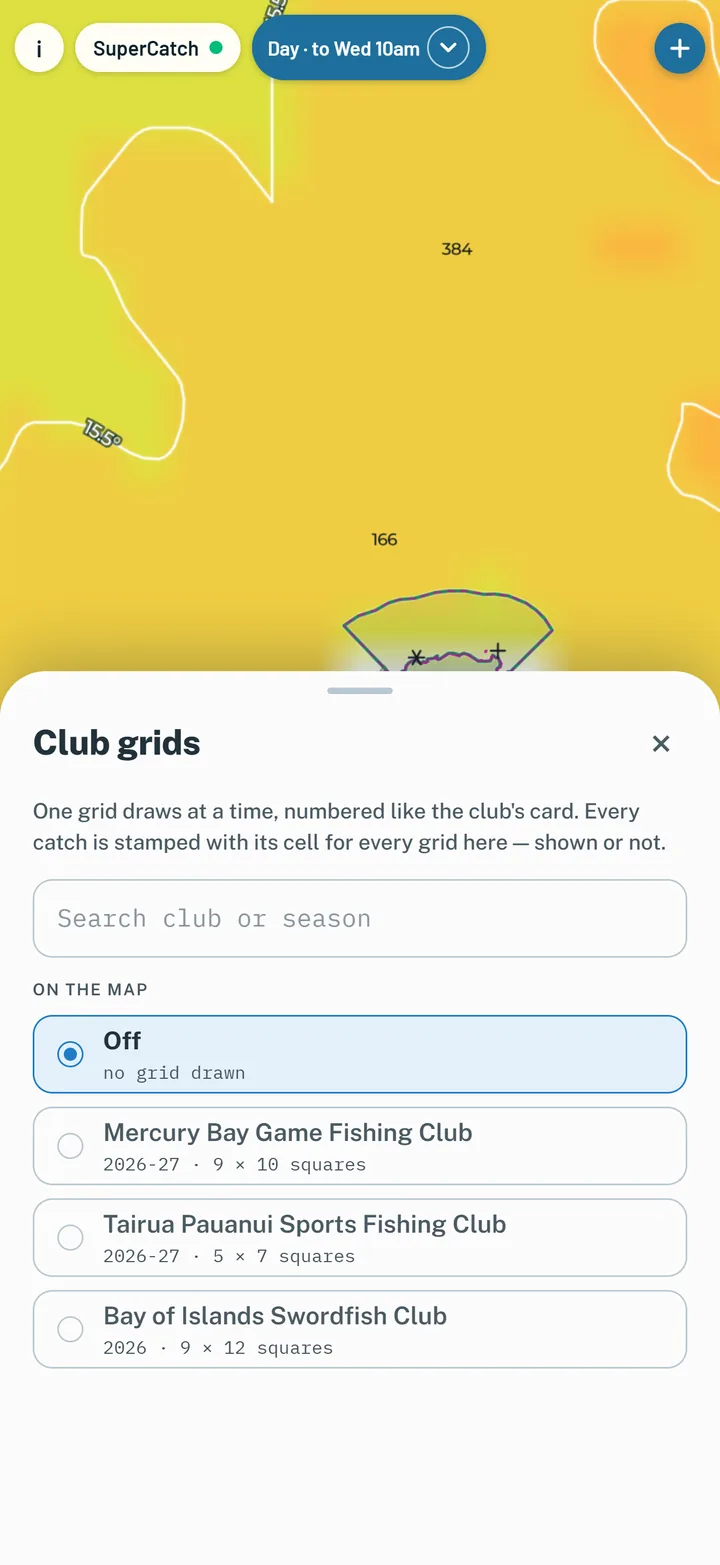
Menu → Club grids opens a searchable sheet - pick a grid to draw it. Every catch is stamped with its square for every grid, whether that grid is drawn or not, so a competition entry is already done.

The Club grids sheet
The Club grids sheet.
Mercury Bay grid
Mercury Bay.
Tairua Pauanui grid
Tairua Pauanui.
Bay of Islands grid
Bay of Islands.
The chip showing the grid square
The square on the chip.

Where you are

What you see

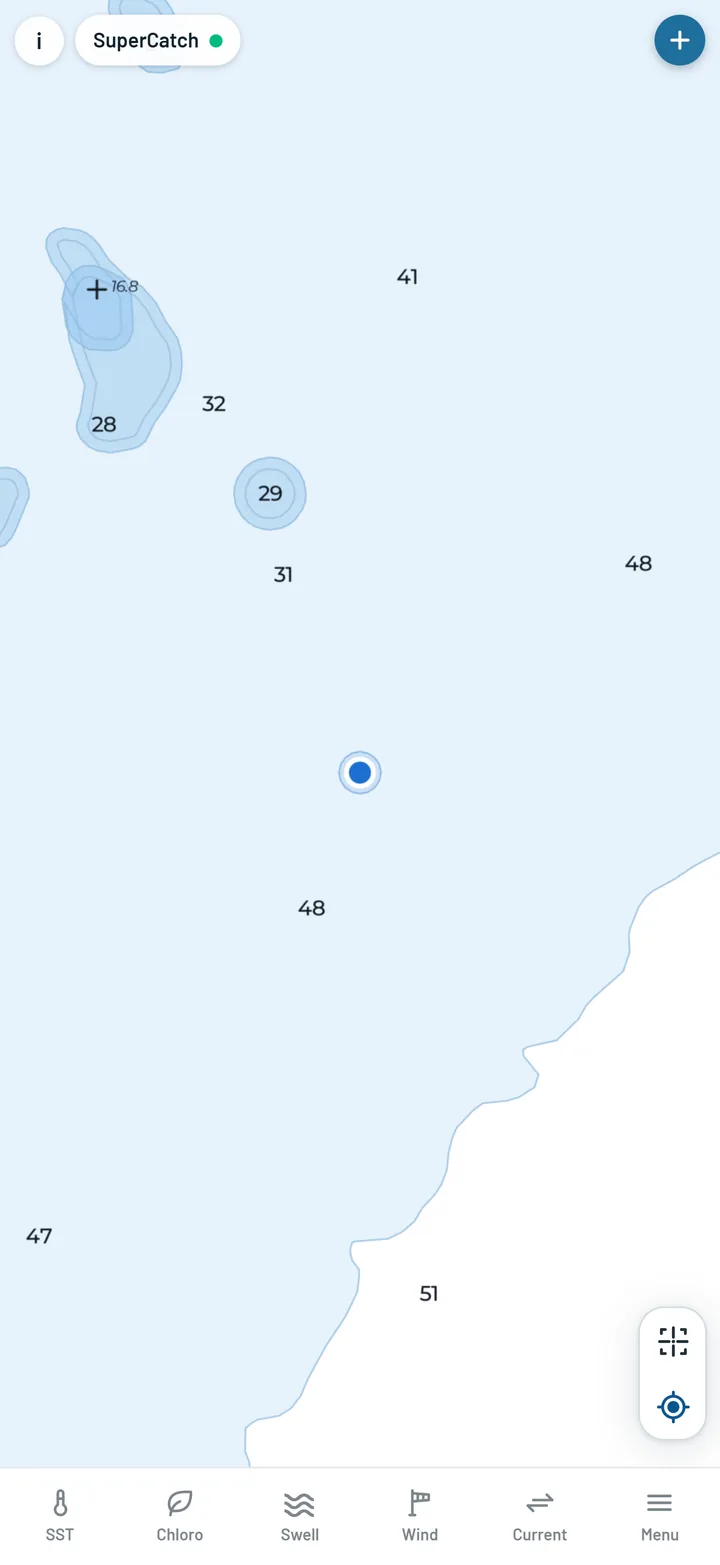
Locate me puts your position on the map as a blue dot with its accuracy ring, and a catch you log takes its position from it.

How to use it

Location only runs while the app is in front of you, and only after you ask - never at launch, never in the background.

Does it track you? No.

Nothing in the app sends where you are on its own, ever. Send feedback never sends where you are - only the part of the map on your screen. Crew sends your position only when you press Send my position, once, as a message. A catch keeps its spot on your phone: the spot is used once to look up the conditions there (not kept), and it goes into your account only if you turn on Position sharing, which is off unless you turn it on.

Locate me: the blue position dot
Locate me.

What it is measured from

Charts and depth

New Zealand contours, soundings, depth areas, seabed type and hazards are LINZ hydrographic data (Toitū Te Whenua Land Information New Zealand, CC BY 4.0). Contours from 100 m down are NIWA's 2016 New Zealand bathymetry (CC BY 3.0 NZ). The depth at a tap comes from the best source at that point, down to the GEBCO_2026 global grid. Australian depths come from the NESP MaC multi-resolution bathymetry composite over a GEBCO base, with Transport WA's 5 m surveys inshore in Western Australia, which also supplies the WA lights and buoys. Tides are LINZ's published high and low water times. The land basemap is from OpenMapTiles and OpenStreetMap contributors.

So pick the ground on the chart, lay the water over it, and let your sounder find the spot.

Catch log

Every catch, with the water it came from.

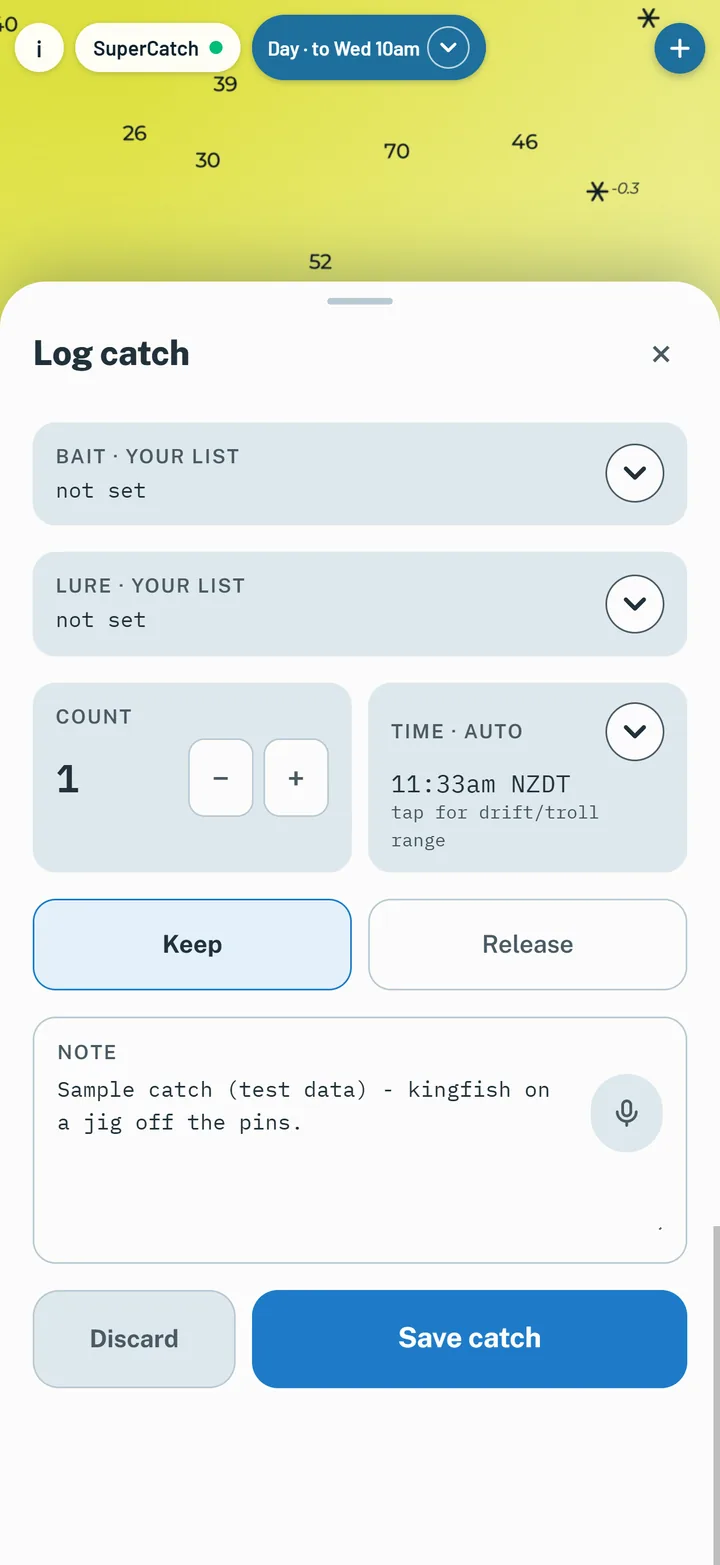
Two taps log a fish, and the conditions at that moment are stamped on it. It saves with no signal too.

Logging a catch

What you see

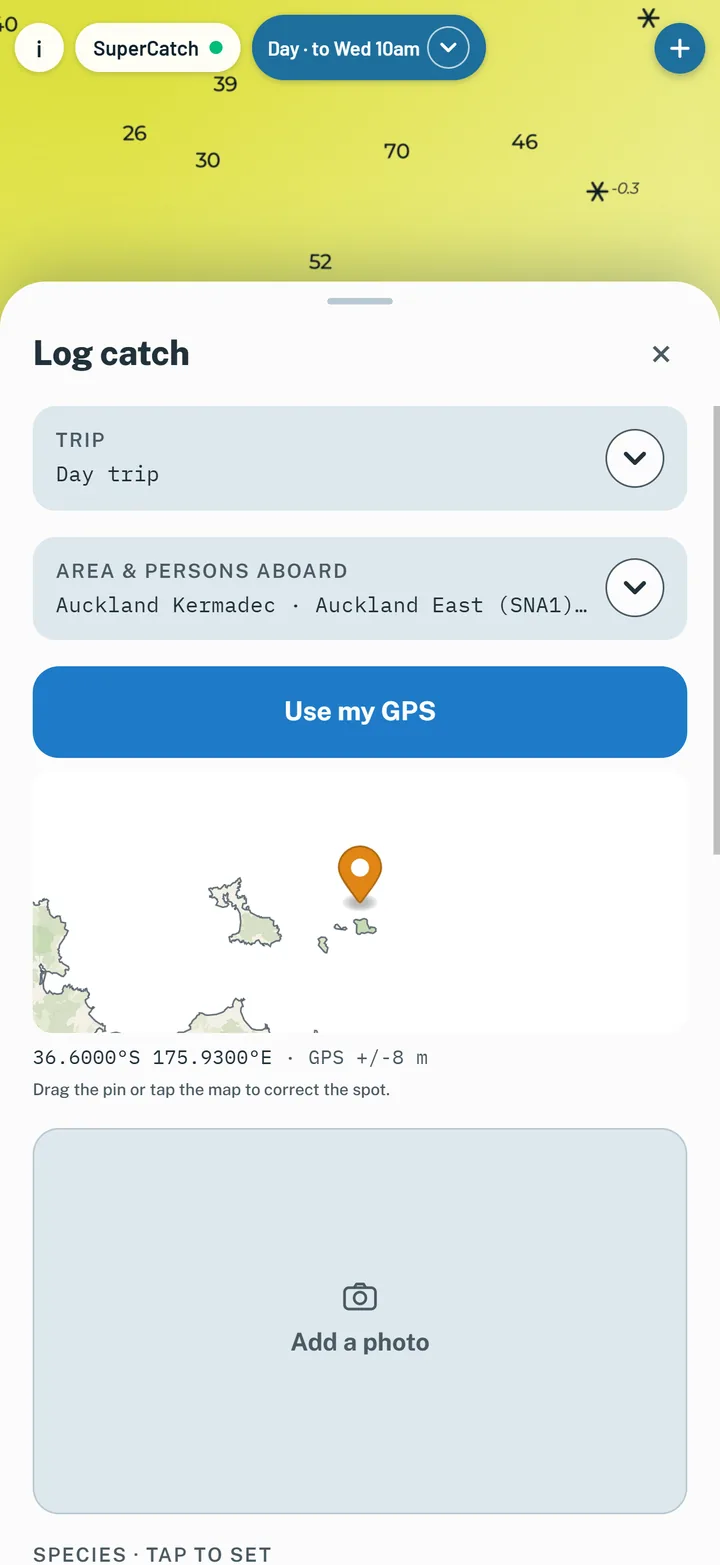
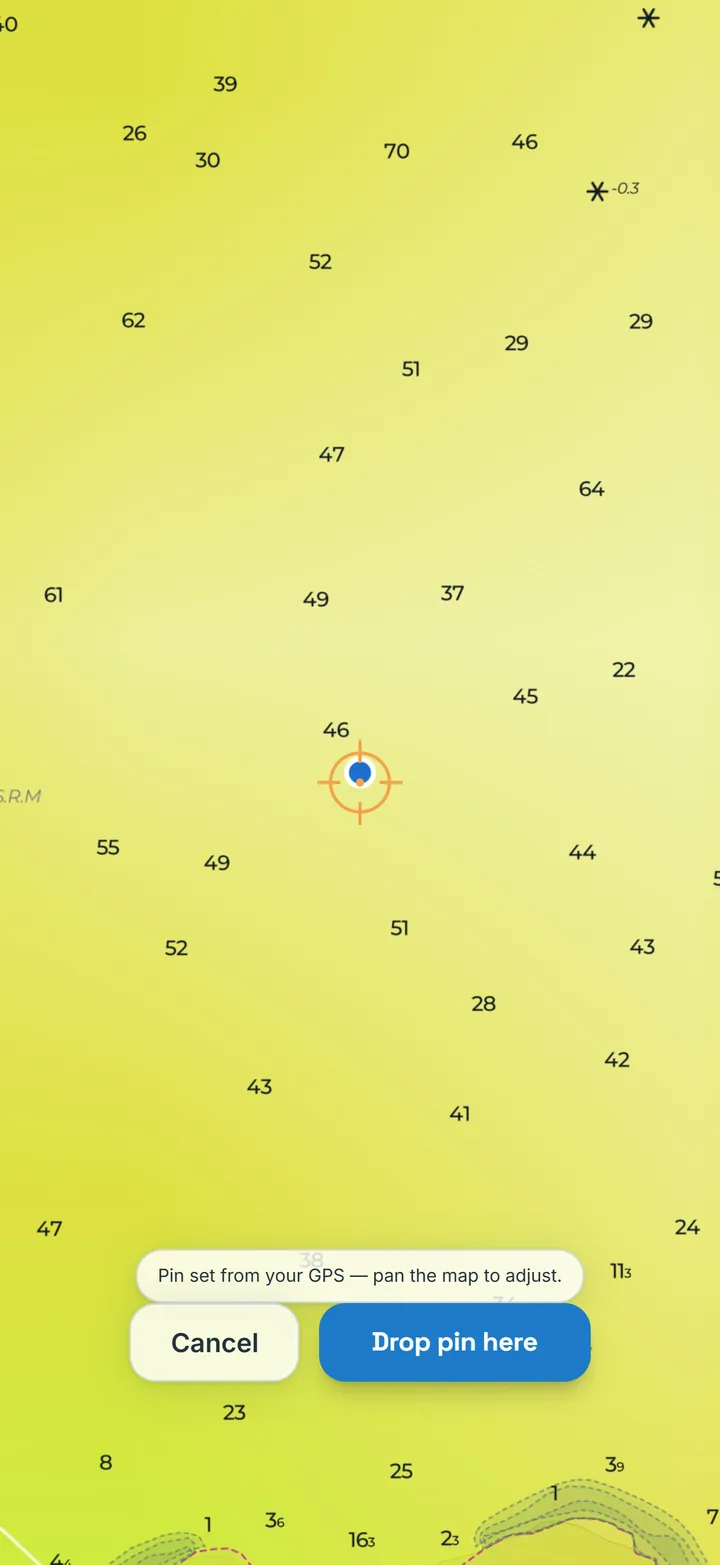
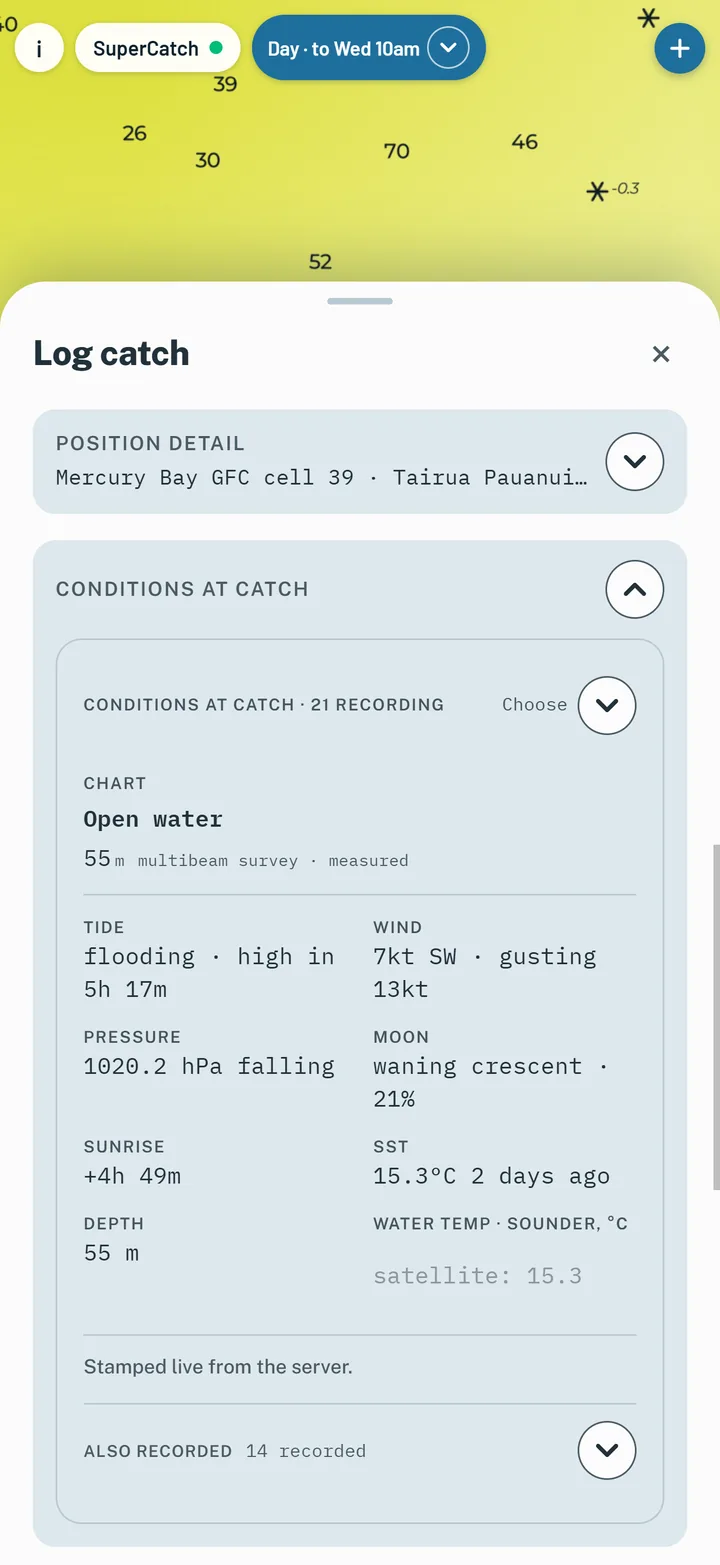
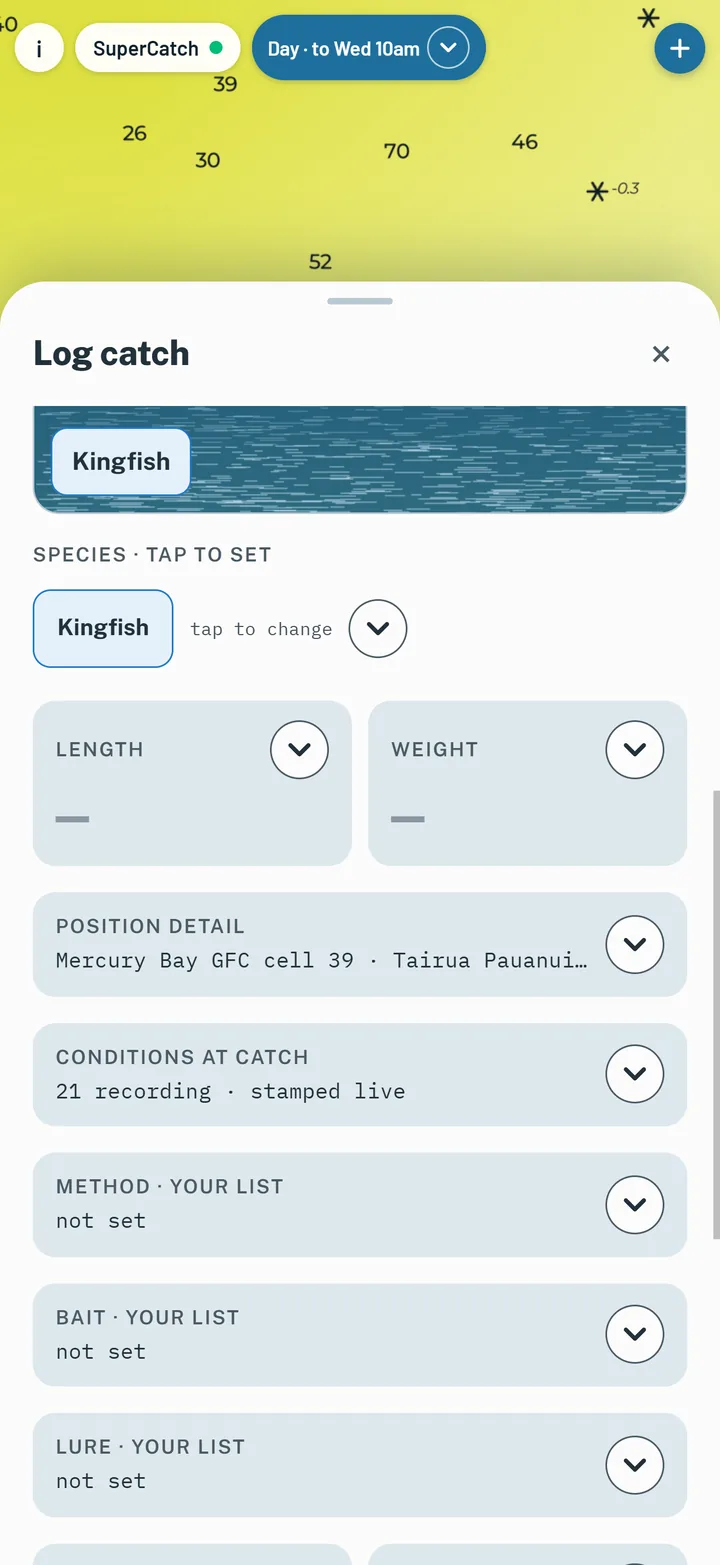
Tap + in the top bar. A marker shows where the catch goes - your GPS spot, or move the map under it - and Drop pin here puts it there. Every catch records every version of sea temperature and chloro (Stable, Day and Live), Clarity, sea height and primary swell, wind and gust, current, pressure, tide, moon, sun, depth and club square. The switches on the catch card only hide rows from view - everything is still recorded.
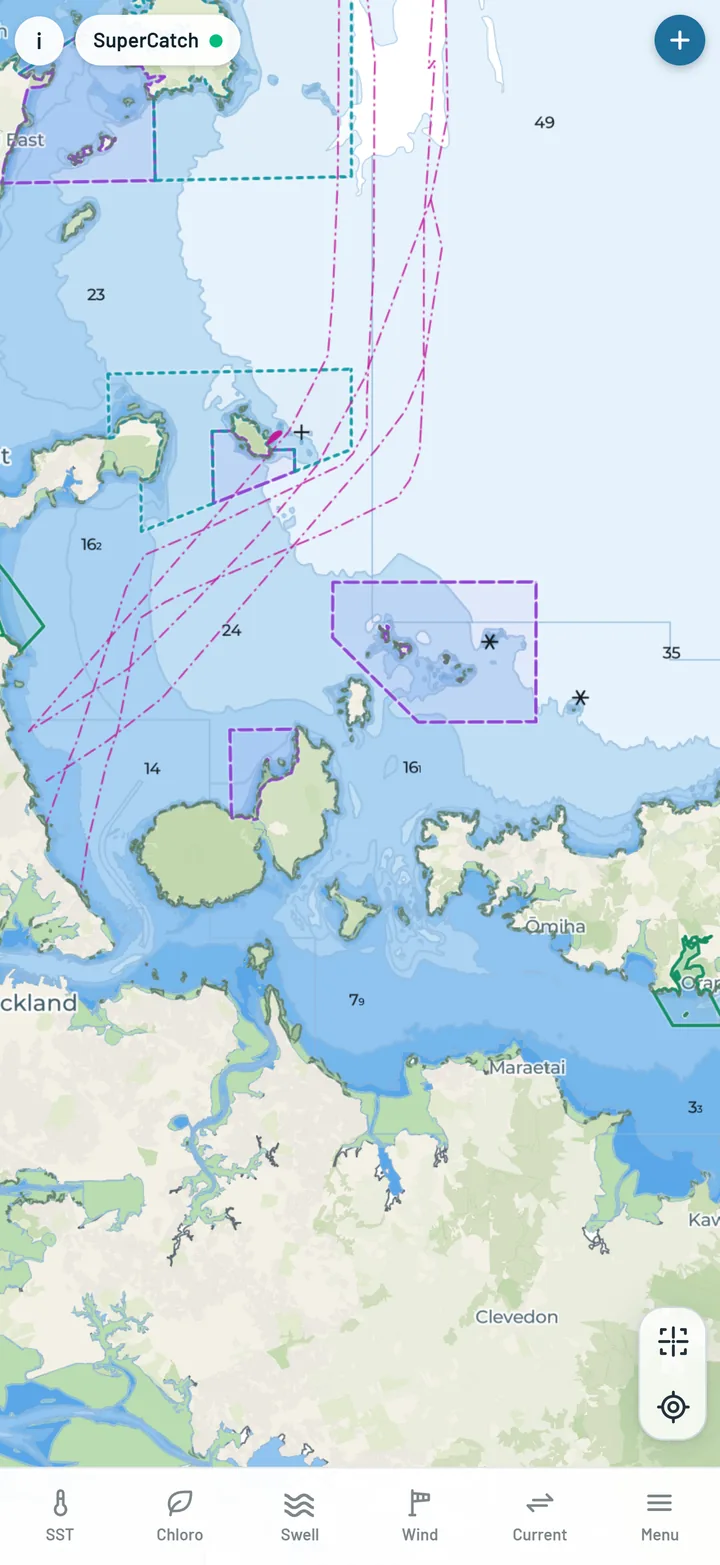
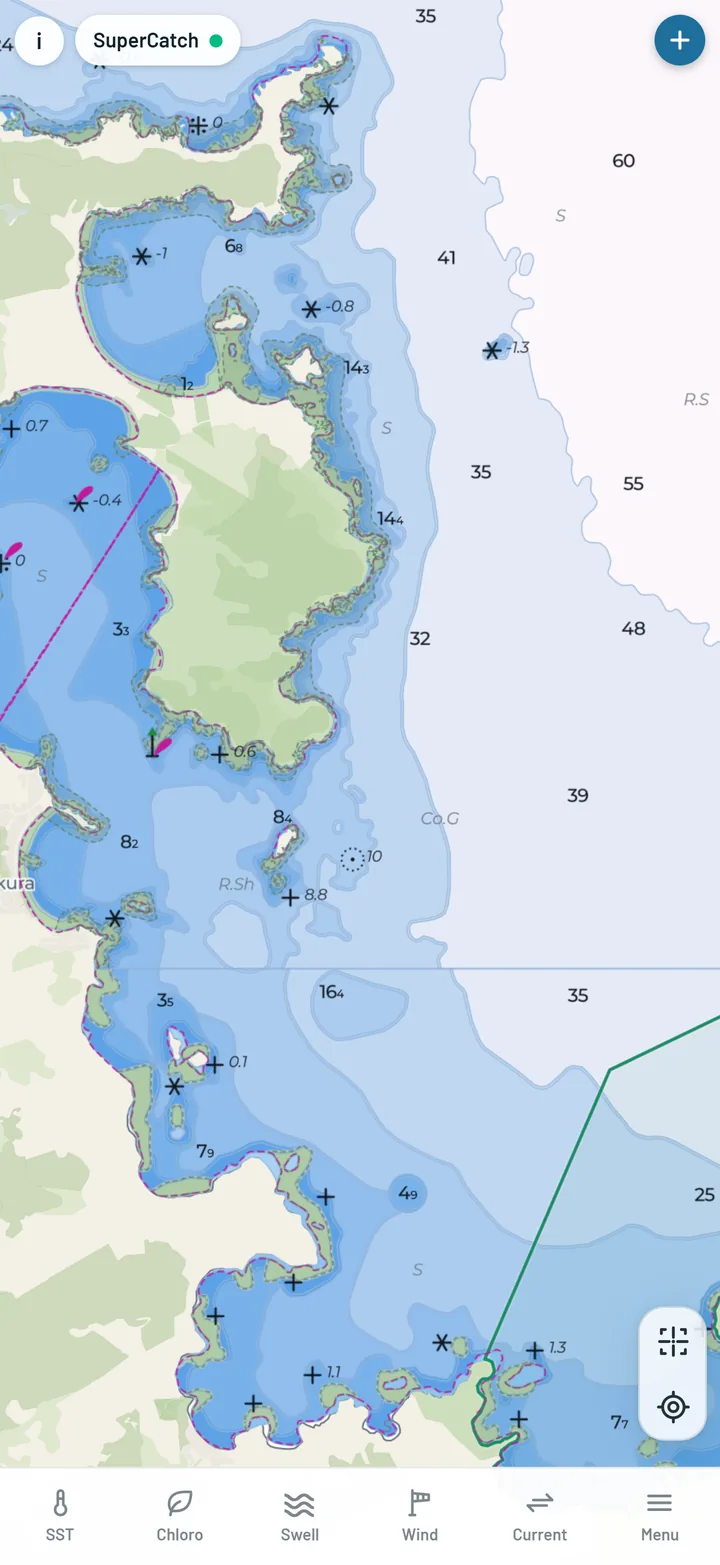
With no signal

The catch still saves, with the moon, sun, depth and tide. Wind, pressure and sea temperature are added when you are back in signal. Anything the phone could not get is marked unavailable with the reason - never guessed. Tip: Settings → Before you leave the dock → Sync conditions for this trip, while you still have signal, and offshore catches get real numbers straight away.
How to use it

Log as you land the fish, then pick the species and add a photo or a note when you have a minute.

The + button in the top bar
Tap +.
Placing the catch pin
Drop the pin.
The conditions stamped on a catch
Conditions, stamped.

Clarity

Copernicus Marine · recorded on every catch, not a map layer

Clarity is how clear the water is, given as a Secchi depth: how many metres down a white disc lowered from the boat would still be visible. It comes from Copernicus Marine's ocean colour data, so it is as old as that data - about two days. It is not drawn on the map; it is stamped on every catch and shows on the saved catch, so over a season you can see whether your fish came in clear water or green.

Species, voice and photos

What you see

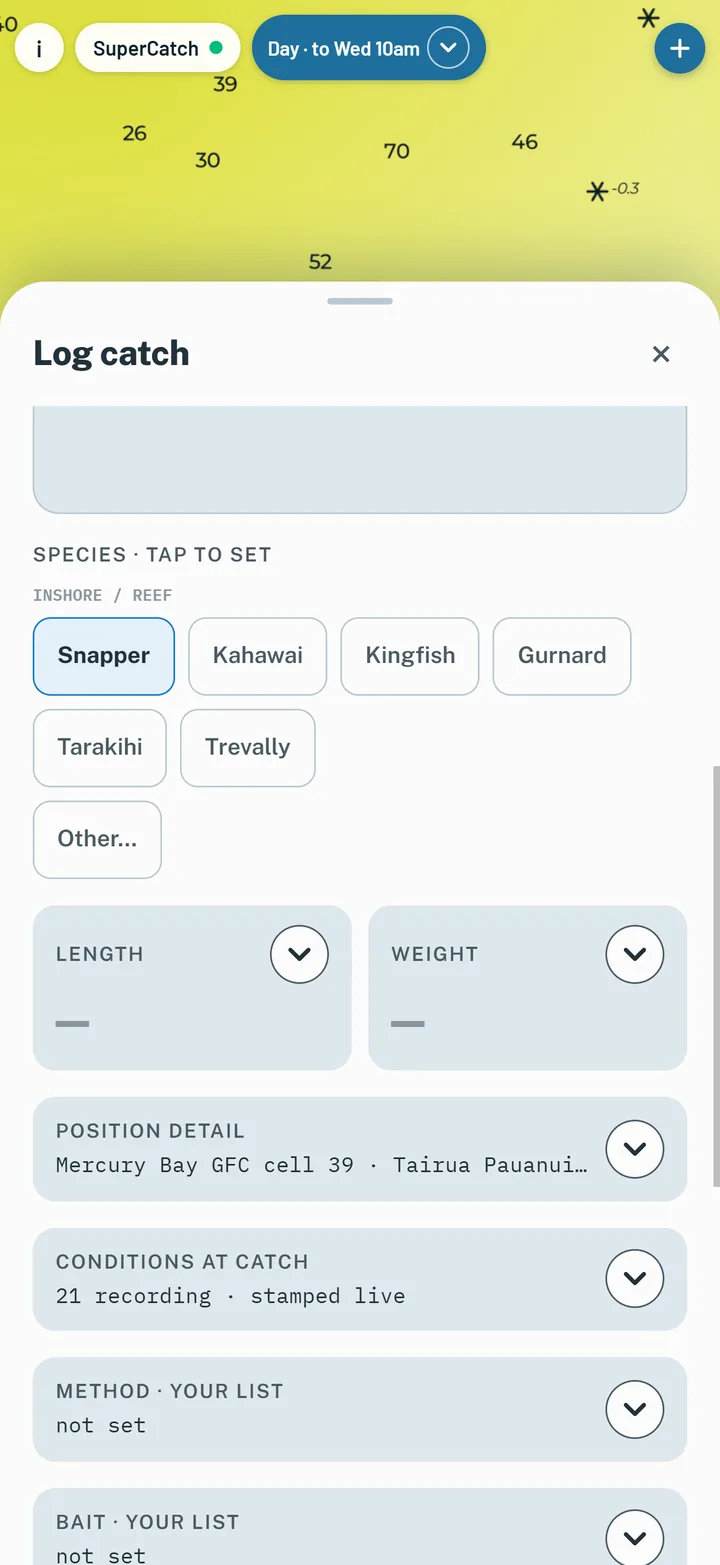
A species picker with New Zealand's MPI size and bag limits, as a guide only, with a link to MPI's own page - the regulation is the authority. There are no rules shown outside New Zealand. The microphone records a voice note and, with signal, also types your words into the note. The recording is kept with the catch as a recording - nothing turns it into words or reads it. Photos are re-encoded on the phone, which strips the camera's metadata, GPS included.

How to use it

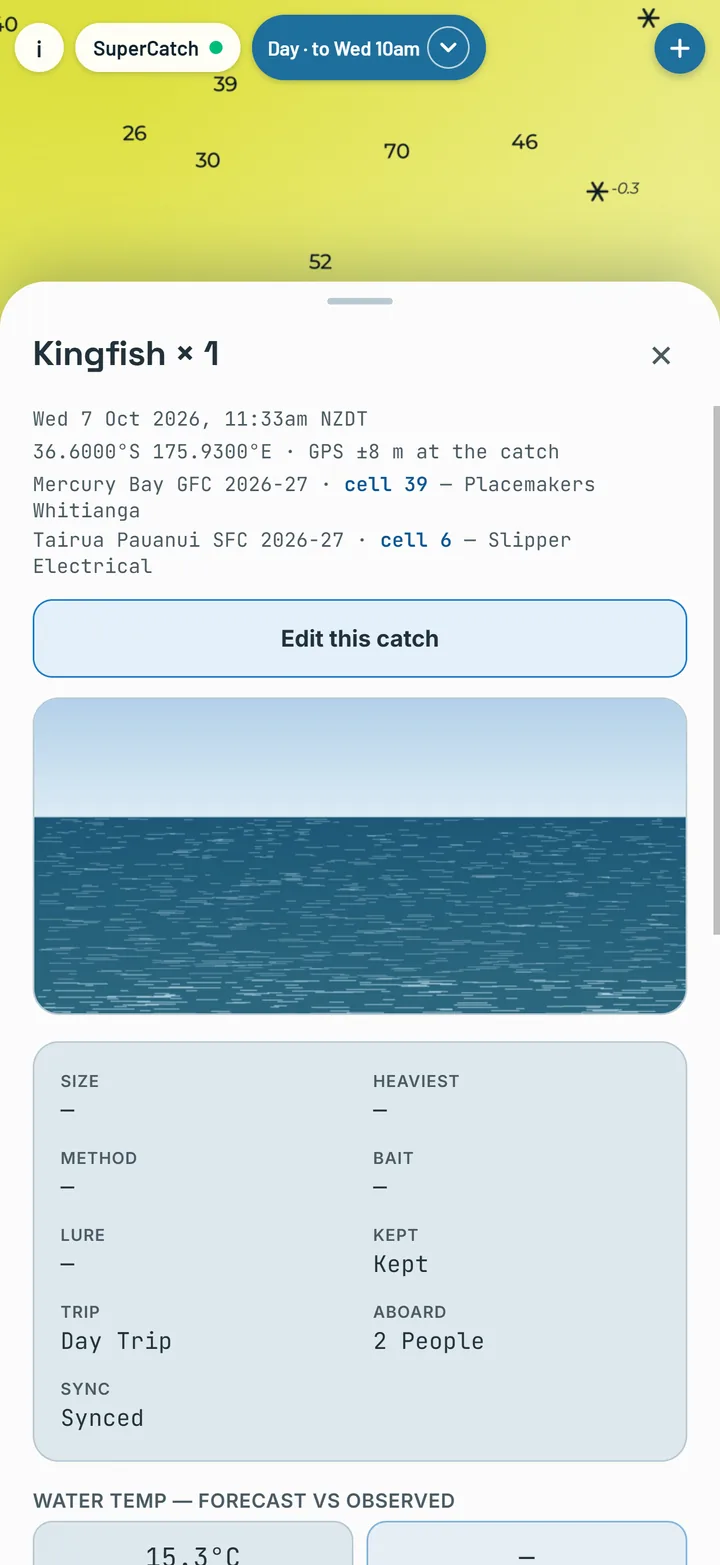
Talk the note while your hands are wet. Check the size limit on the spot. The saved catch opens later with everything on it - the photos, the tag and the voice note too - and Edit this catch fixes a mistake.

The species picker
Species and rules.
Recording a voice note
Voice notes.
Adding a photo to a catch
Photos.
A saved catch
Saved.

Trips and the Fish counter

What you see

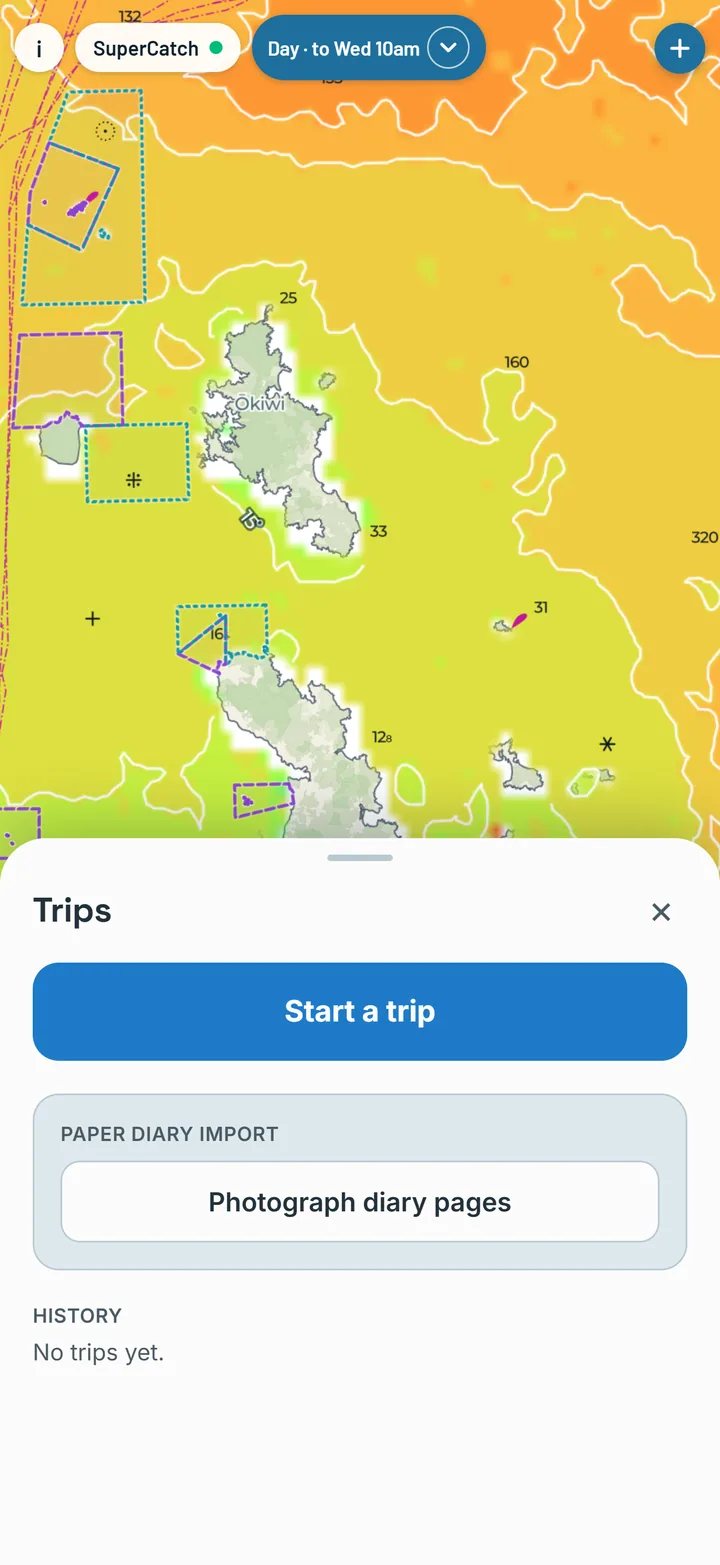
Trips bracket a day on the water, with the conditions through the day and every catch attached. The Fish counter is a one-tap tally for a busy session.

How to use it

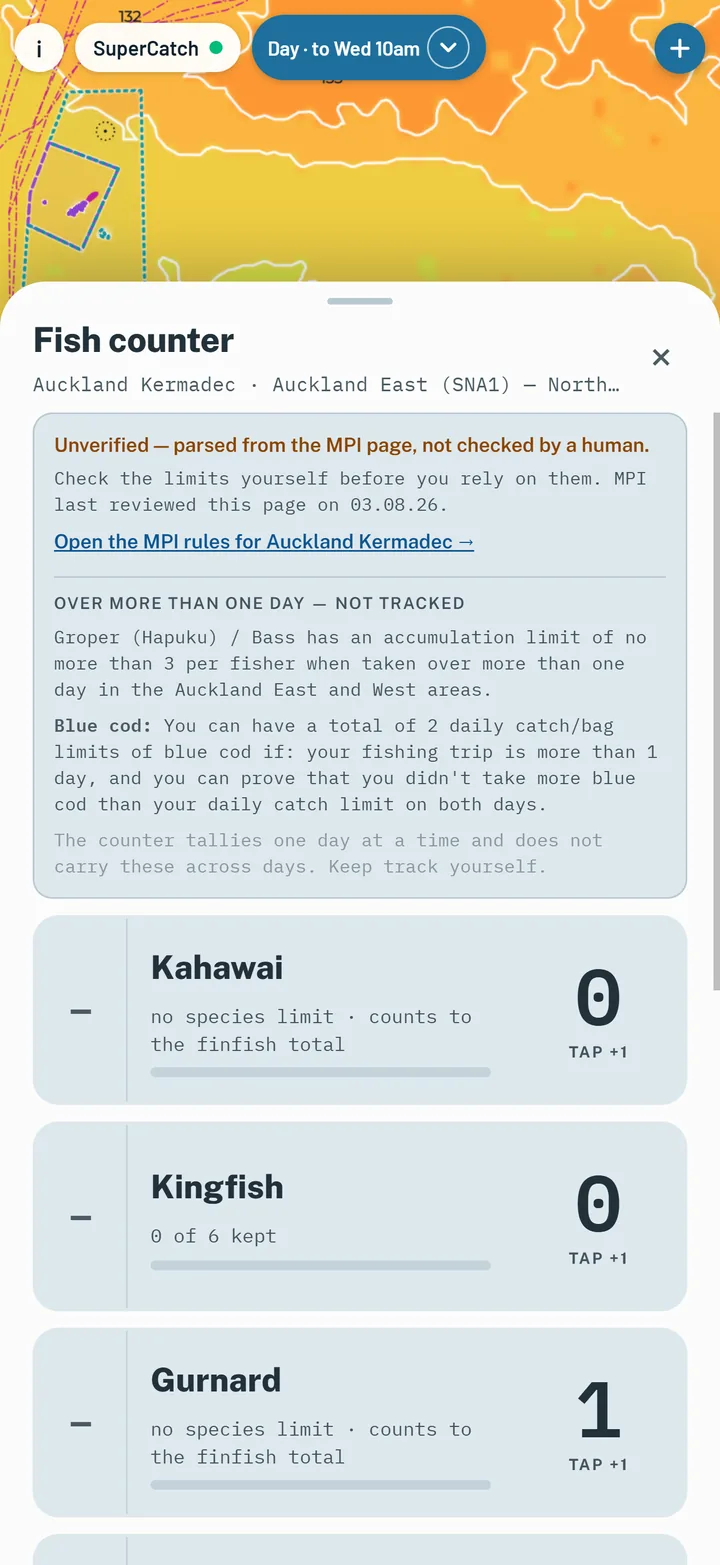
Start a trip as you leave the ramp. When you want a count against the bag limit, open the Fish counter from the menu and tap Start counting - it never starts on its own, and logging a catch never adds to it. Hit the counter every fish on a hot bite, and sort kept from released on the way home.

The Trips sheet
Trips.
The Fish counter
Fish counter.

Marks and saved spots

What you see

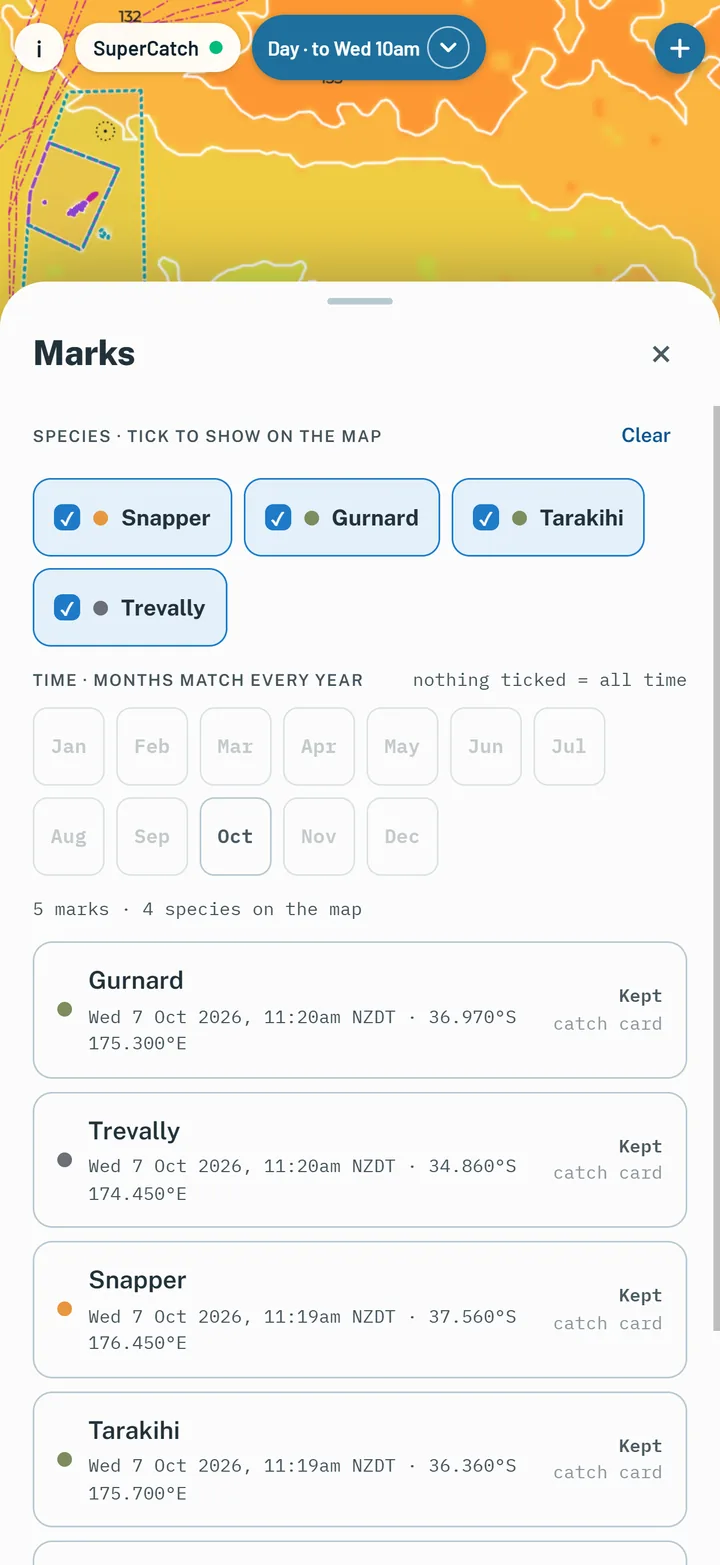
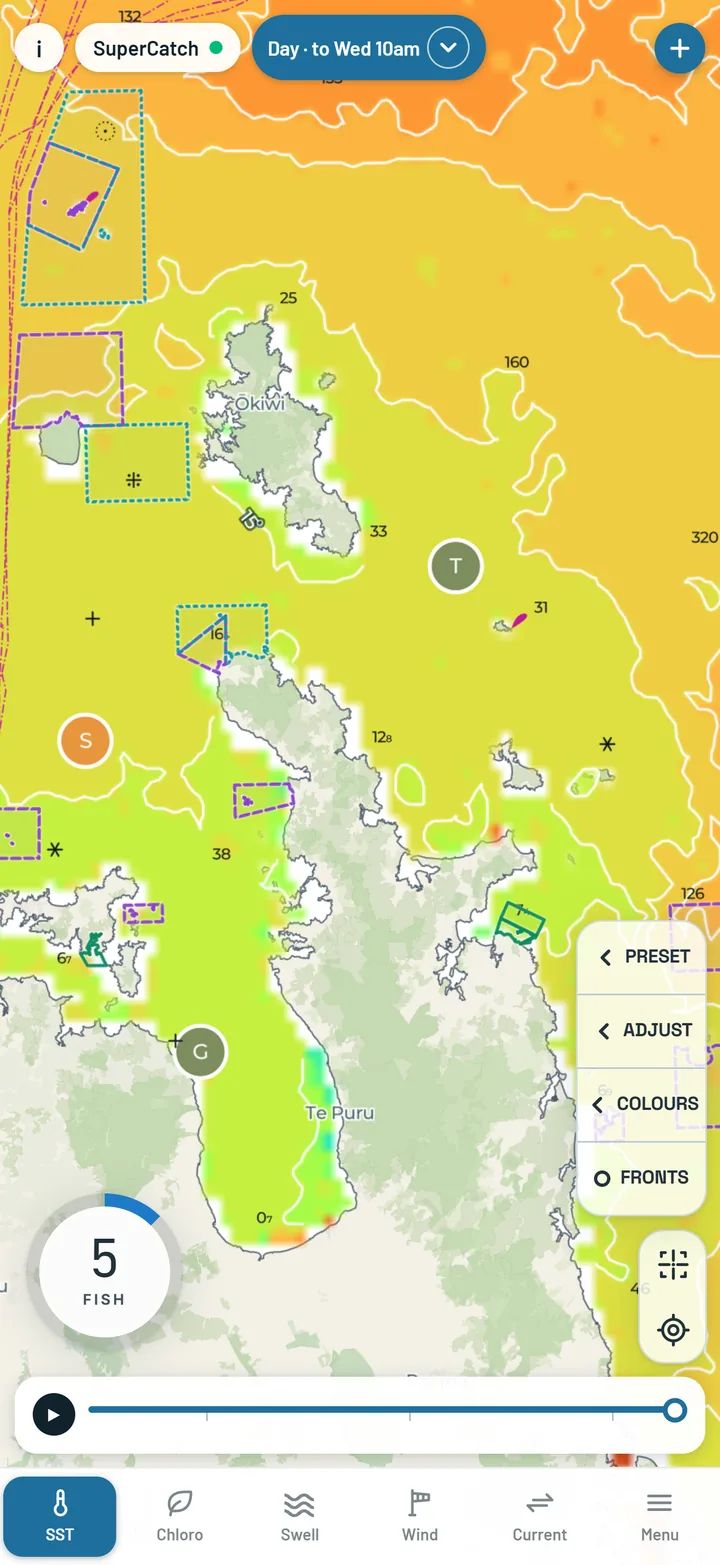
Marks puts your catches on the map, filtered by species, month and year. Saved spots are positions your crew sent you that you kept with "Save as spot"; they are stored on your phone. The Saved spots switch in the Menu shows or hides them, and your catch pins with them.

How to use it

Pick a species and a month and see where it has come from in past seasons - then lay this week's water over the top.

The Marks sheet with species and month filters
Marks.
Saved spots on the map
Saved spots.

Crew and Insights

What you see

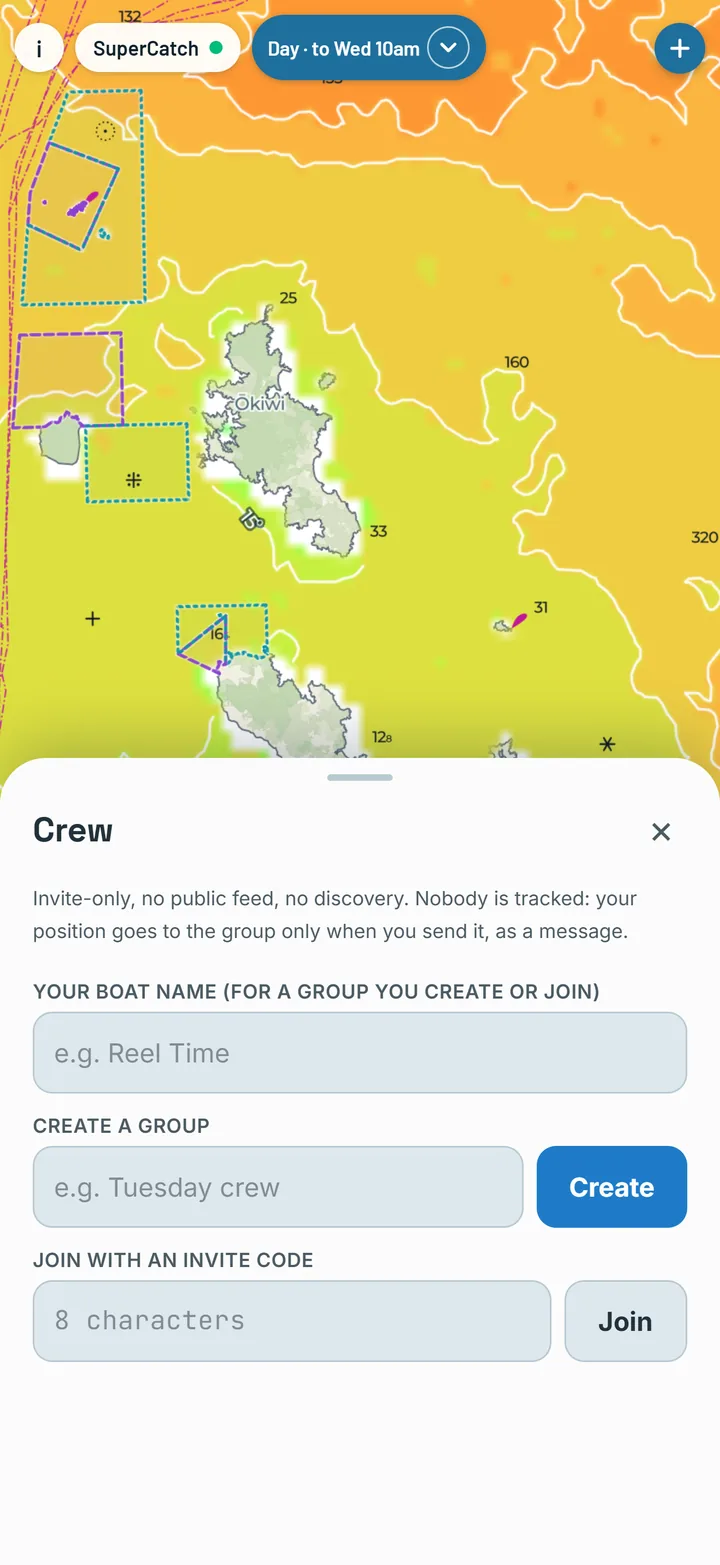
Crew (Ocean plan) is private groups for your boat or club: messages, and your position - but only when you tap Send my position, and then it goes once, as a message. Nobody is tracked and there are no live boat dots on the map. A position someone sends you has Show on map and Save as spot. When you share a catch you choose the exact position, a general area (about 11 km), or no location at all.

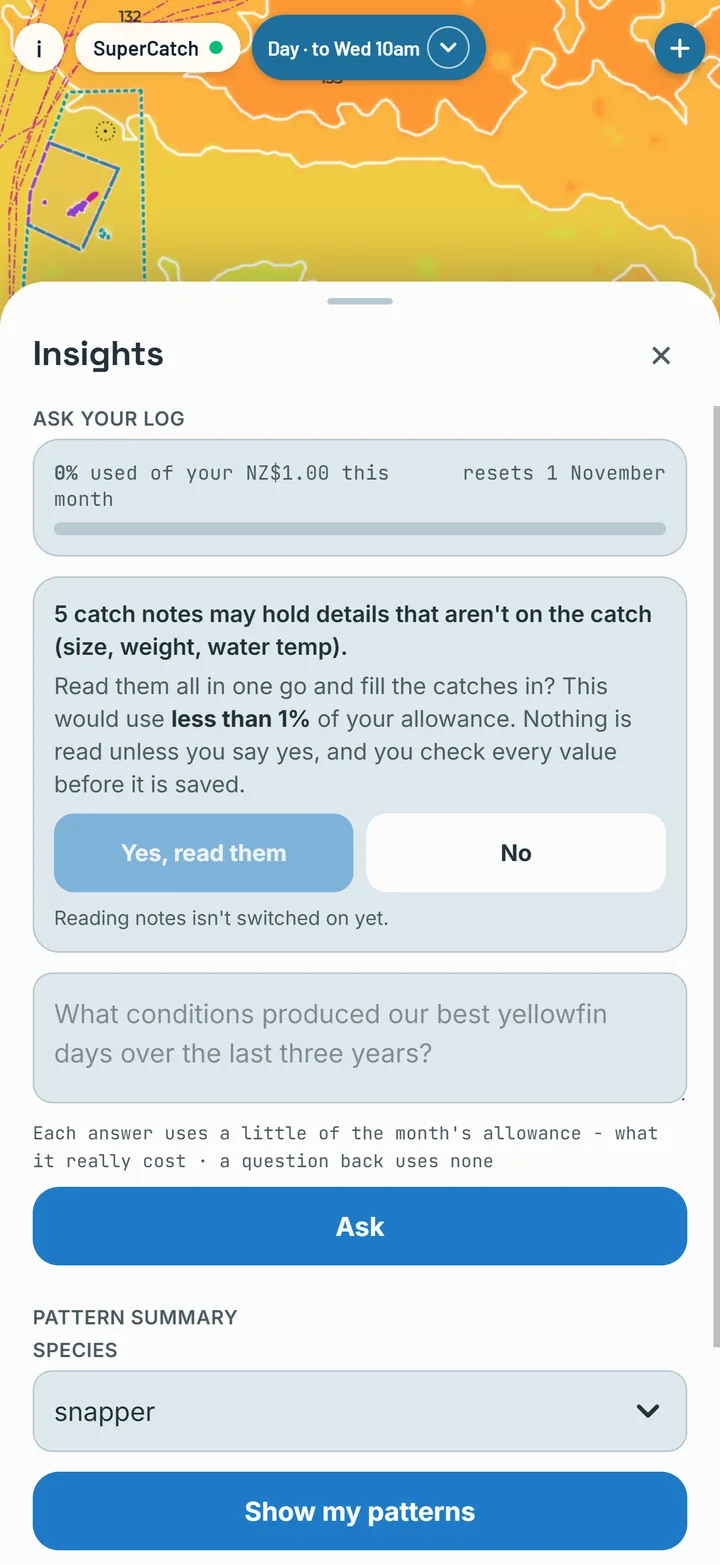
Insights answers questions about your own catch log. During testing it gives counts and simple summaries from your catches - the full written answers are not switched on yet.

Each account has NZ$1.00 of Insights a month. It is measured by what each answer really costs to produce, so a short question uses less than a big one. A bar above the question box shows how much of the month's allowance is used. When it is used up, Insights says so and answers again from the 1st of next month. Reading paper diary photos comes out of the same allowance.

Good to know

Crew checks for new messages every 30 seconds while the app is open. There are no push notifications, so a message waits until you open the app.

How to use it

Share the day with your crew without giving away the mark. Ask Insights things like which species you caught most this season.

The Crew sheet
Crew.
The Insights sheet
Insights.

Taking it offshore

What you see

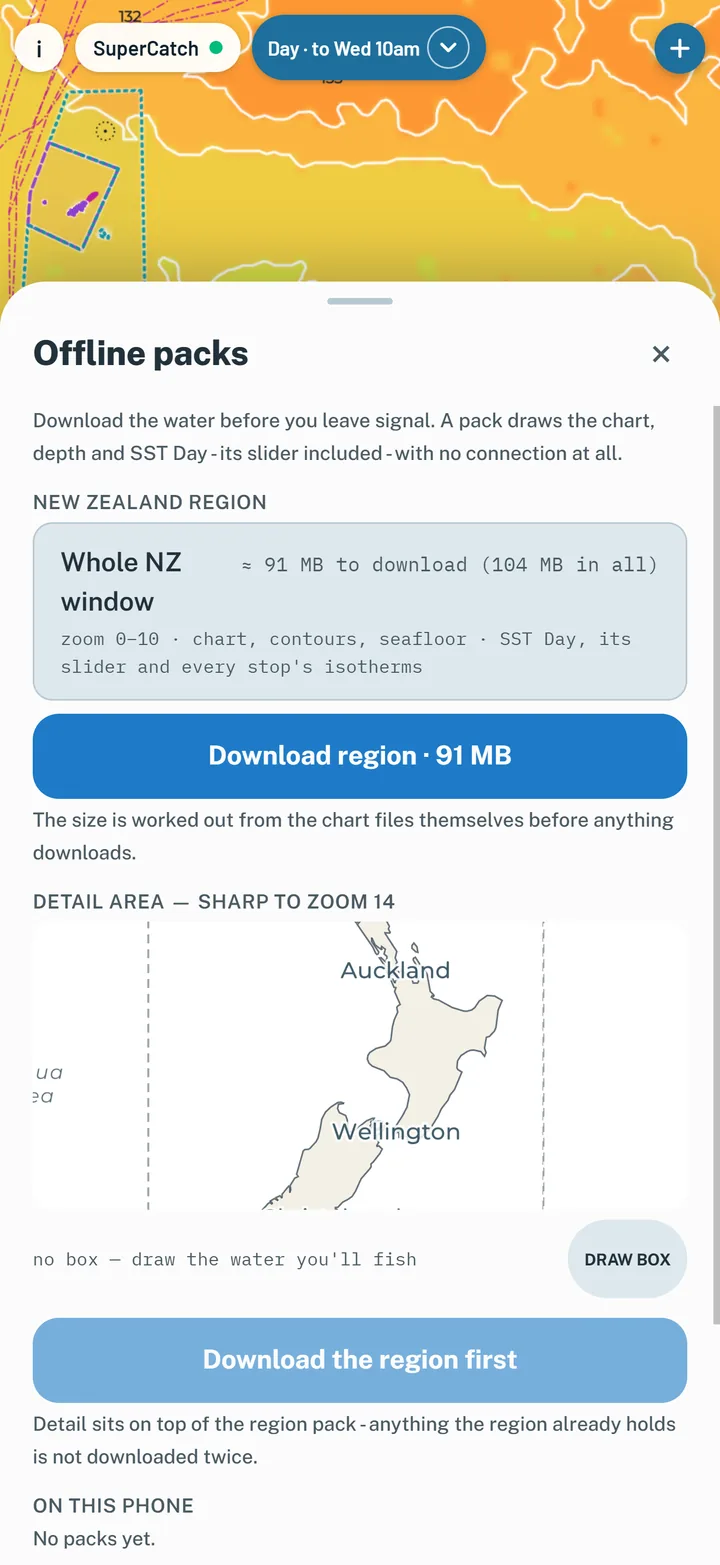
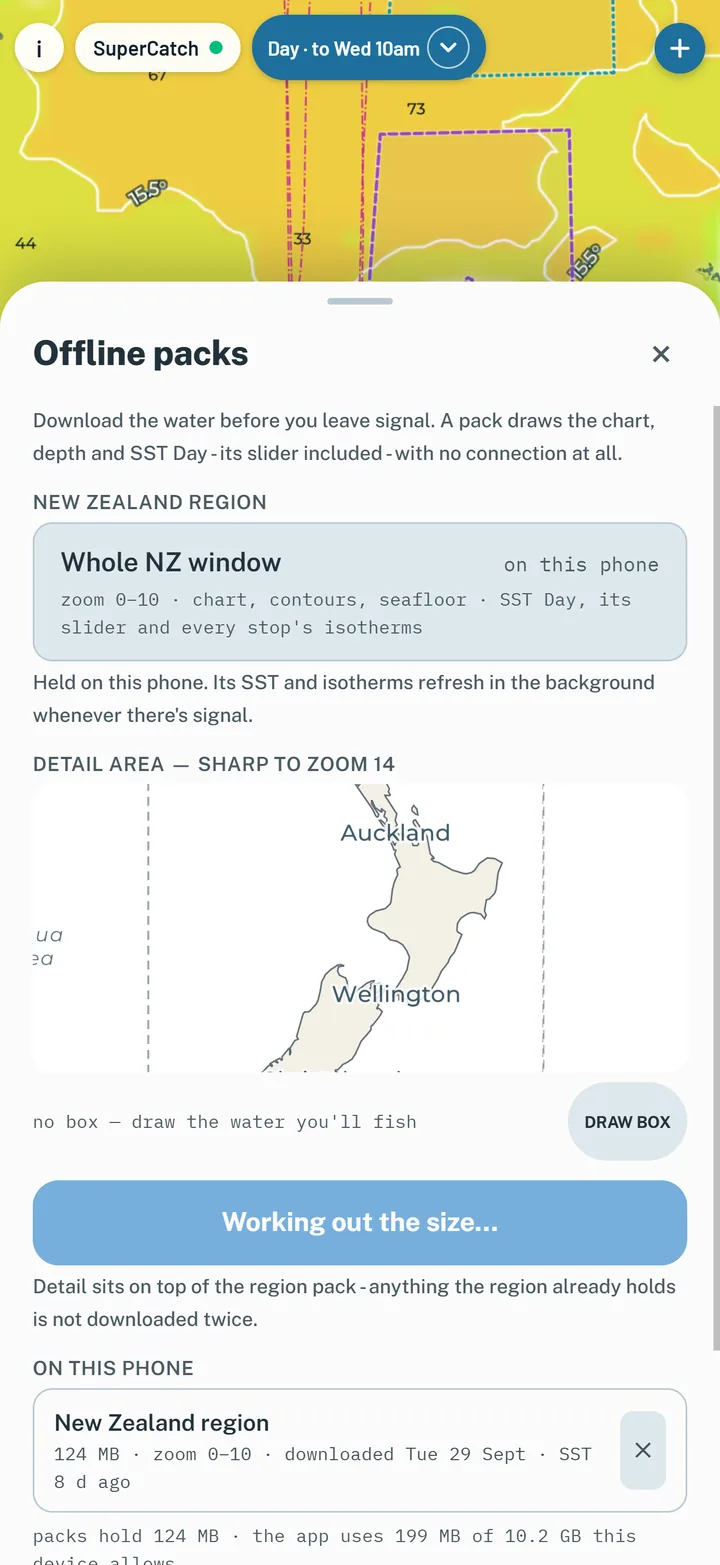
Menu → Take it offshore opens the offline packs, which are New Zealand only. The New Zealand region pack holds the chart, contours and seafloor for the whole country, plus SST Day with its slider and isotherms. A detail pack adds sharper chart over a box you draw. The size shows before anything downloads.

How to use it

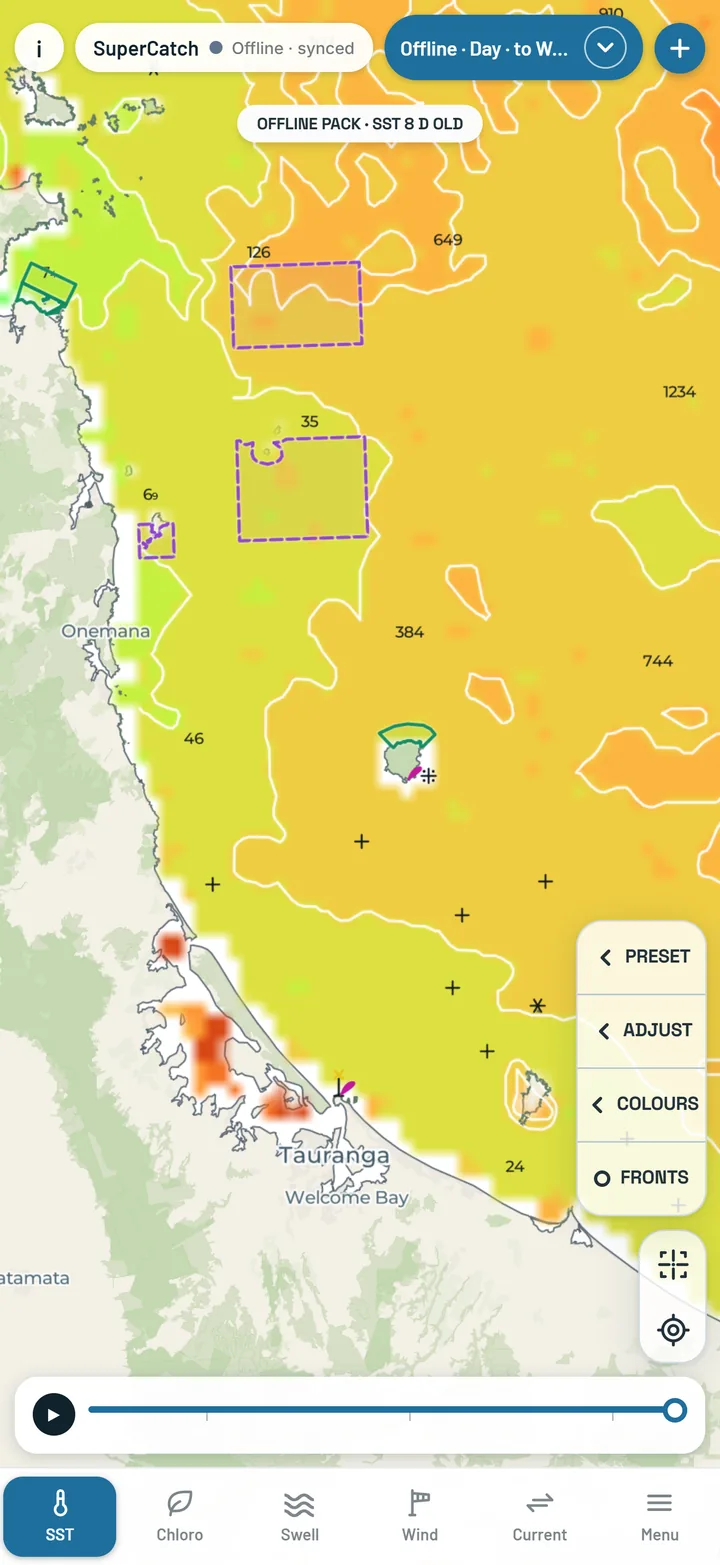
Download before you leave signal. Offline, the map draws from the pack, layers a pack does not carry are dimmed, and the map tells you when you are outside your pack. Catches log and stamp their conditions either way.

The offline packs sheet
Offline packs.
A pack downloading
Downloading.
The map offline, drawn from a pack
Offline, from the pack.
Your data

Your account, your plan, your spots.

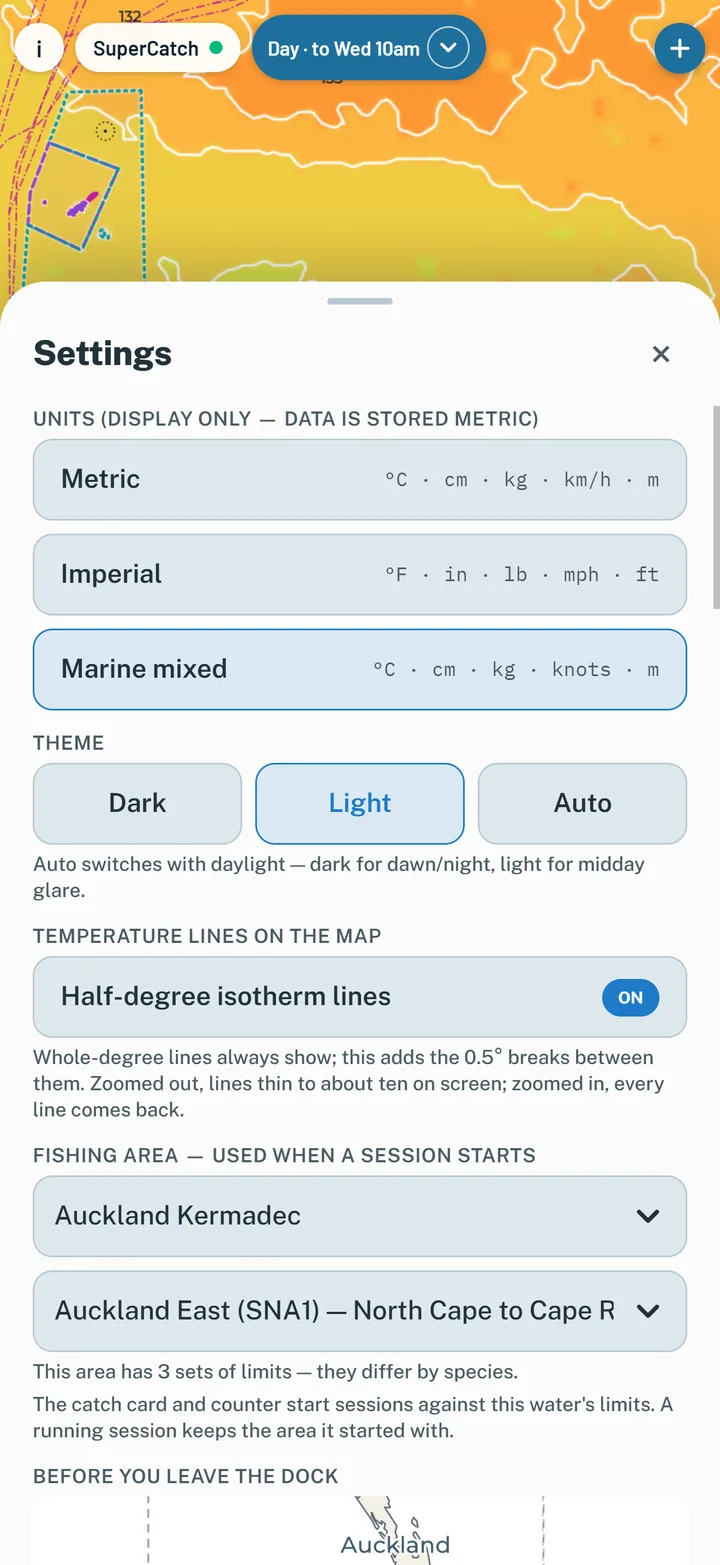
Everything about you lives in Menu → Settings. Your positions stay private unless you choose otherwise.

Send feedback

How it works

Menu → Send feedback, the first row. Tap the big microphone, say what you want to say, tap it again, then Send. When there is signal your words appear as you talk; the recording itself always goes too, so nothing is lost if the words come out wrong.

What goes with it

What you were looking at (the layer, the version and the view), the part of the map on your screen (its middle and zoom), a picture of the map, your phone and its software version, the app build, your plan, and your email if you are signed in. It never sends where you are (see Where you are). With no signal it says "Saved on the phone" and sends itself later.

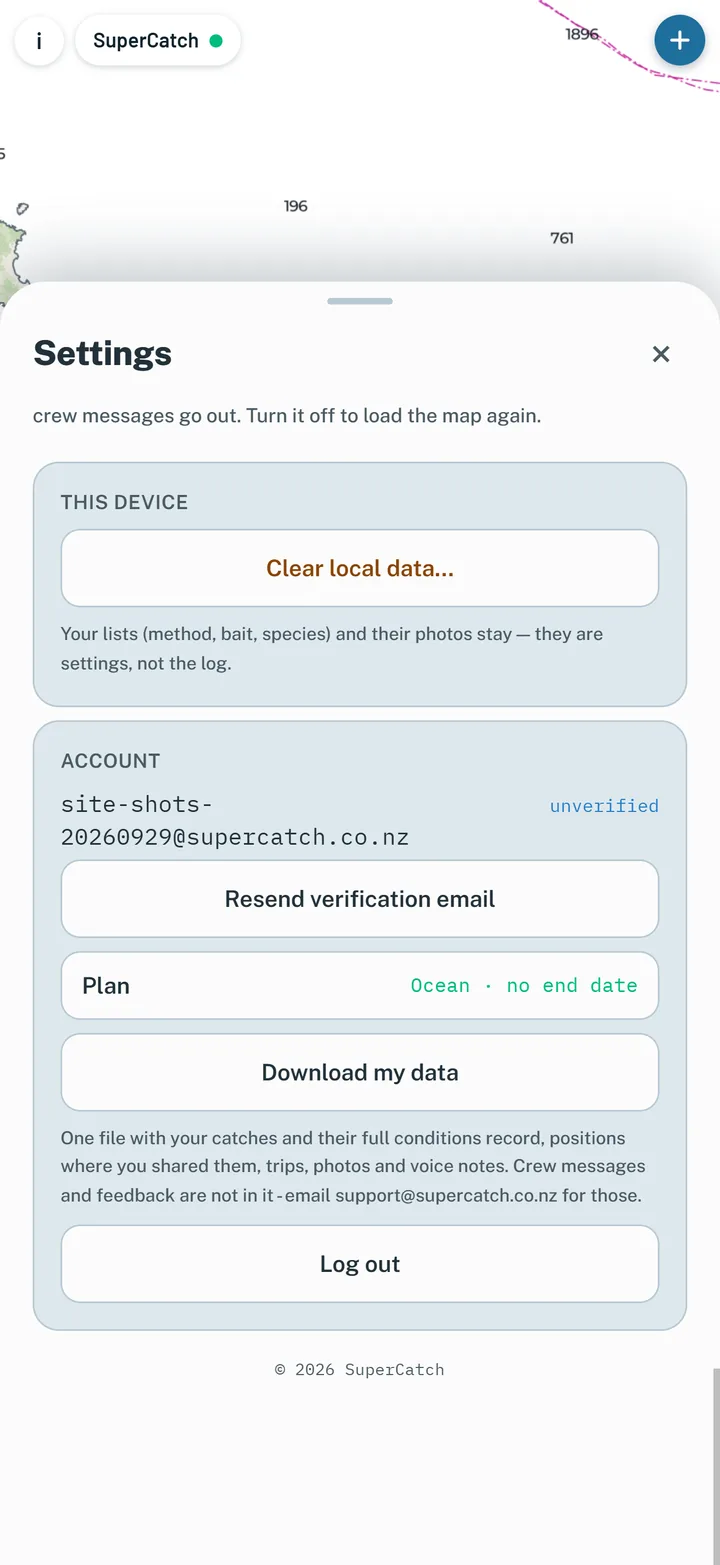
Account and plan

What you see

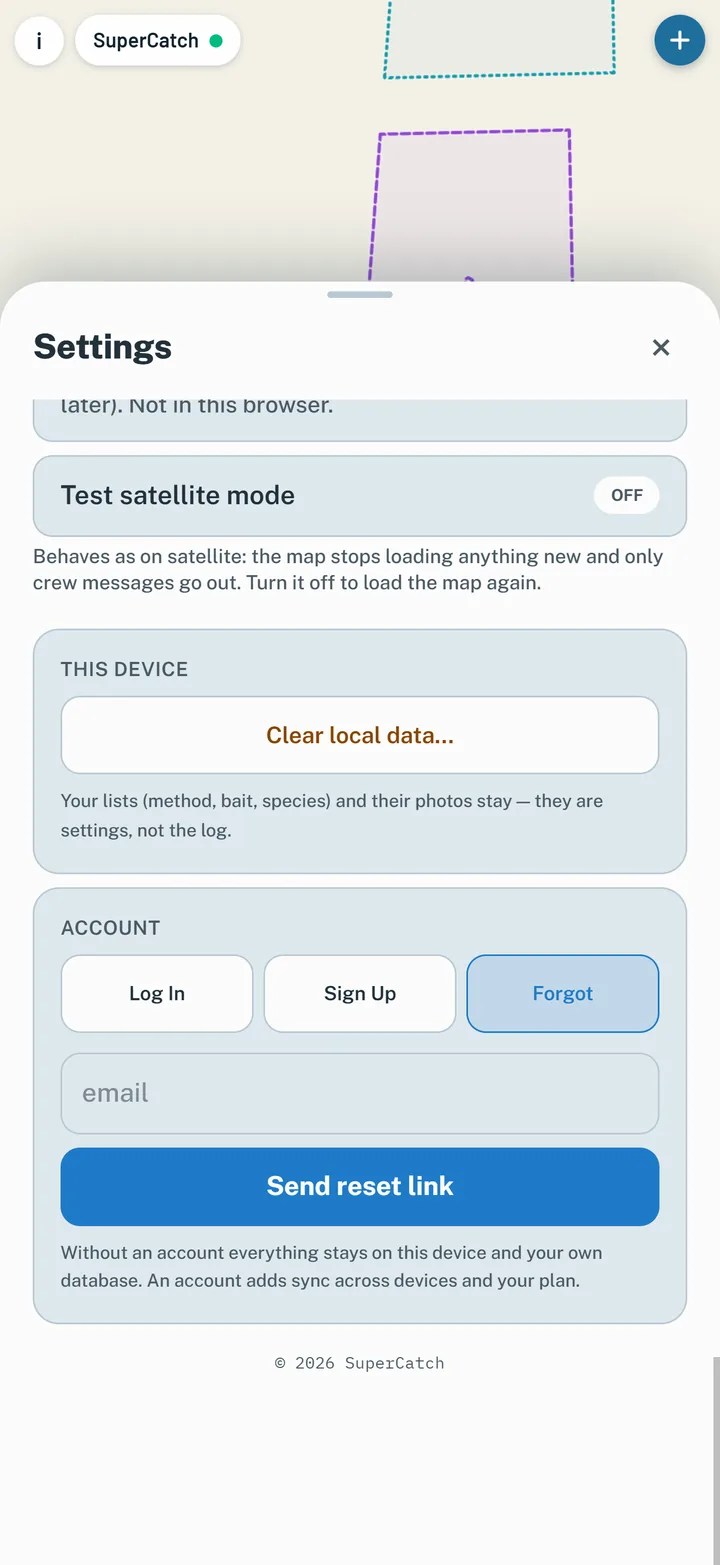
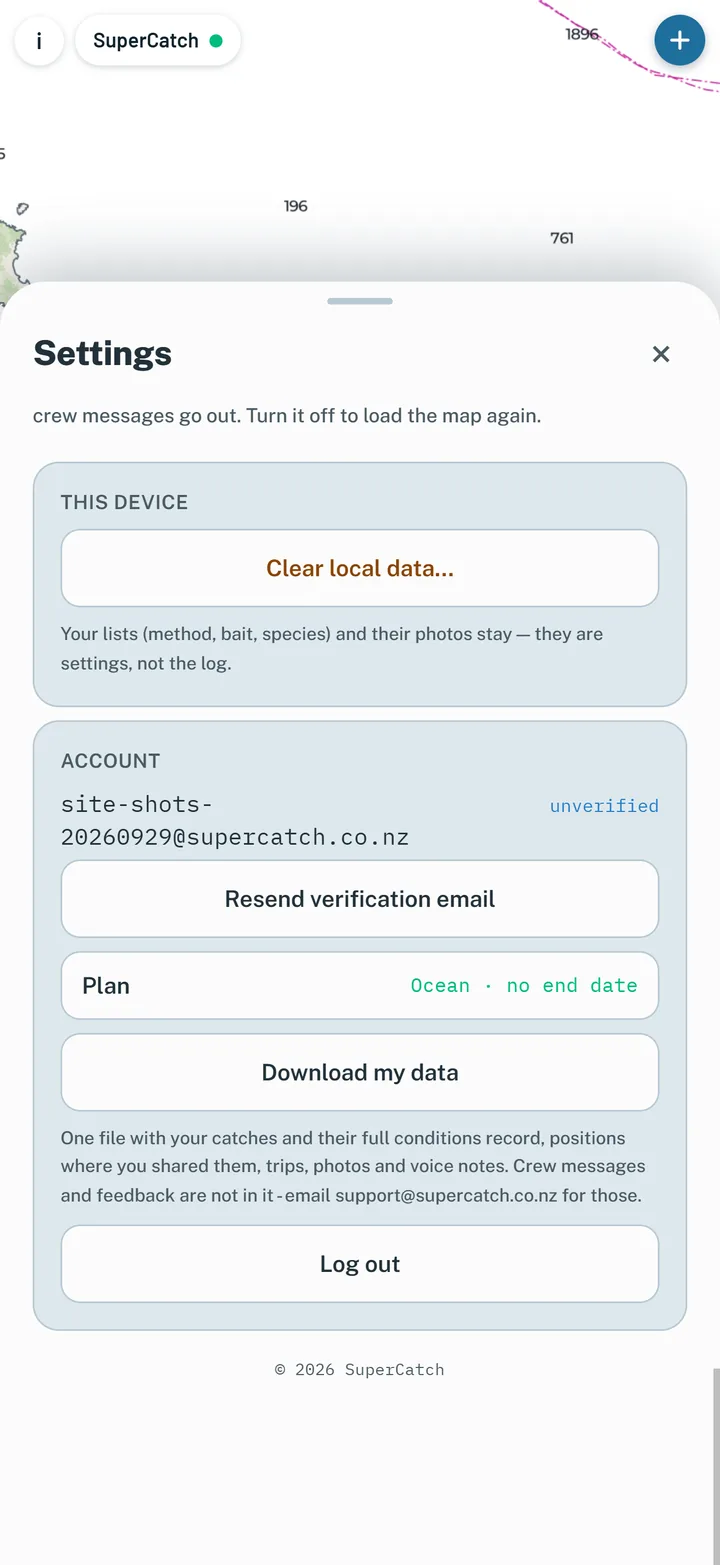
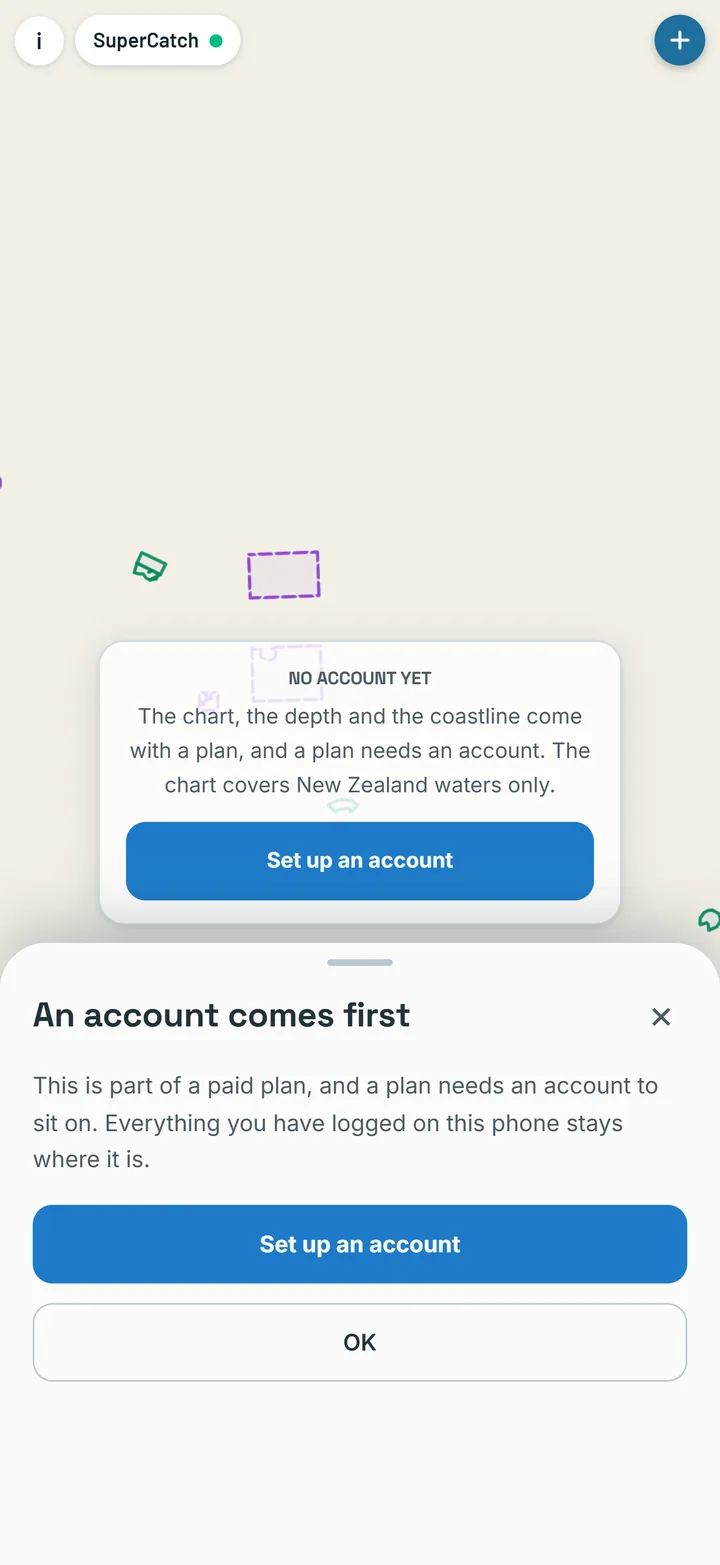
The chart and everything else need an account and a plan. Sign up, log in and reset a forgotten password in Settings → Account. You confirm your email address from a link we send. Your plan is shown there too, and a padlock marks any layer outside your plan.

The two plans

Chart (NZ$5 a month, or NZ$40 for twelve months): the New Zealand chart and depth, swell, wind, current, the catch log, trips and club grids. The chart is New Zealand only - outside New Zealand there is no marine chart. Ocean: everything in Chart, plus every SST and Chloro version, Fronts and Crew - and Ocean works everywhere SuperCatch covers, New Zealand, Australia and the Pacific from Lord Howe to Fiji, so it is the plan for anyone fishing outside New Zealand. Chloro Day is New Zealand only, and SST Stable stops at 180° - it does not reach the Lau Group. Buying a plan is not open yet - during testing, plans are switched on by SuperCatch.

How to use it

Forgot your password? Tap Forgot, and the email link takes you to a page to set a new one.

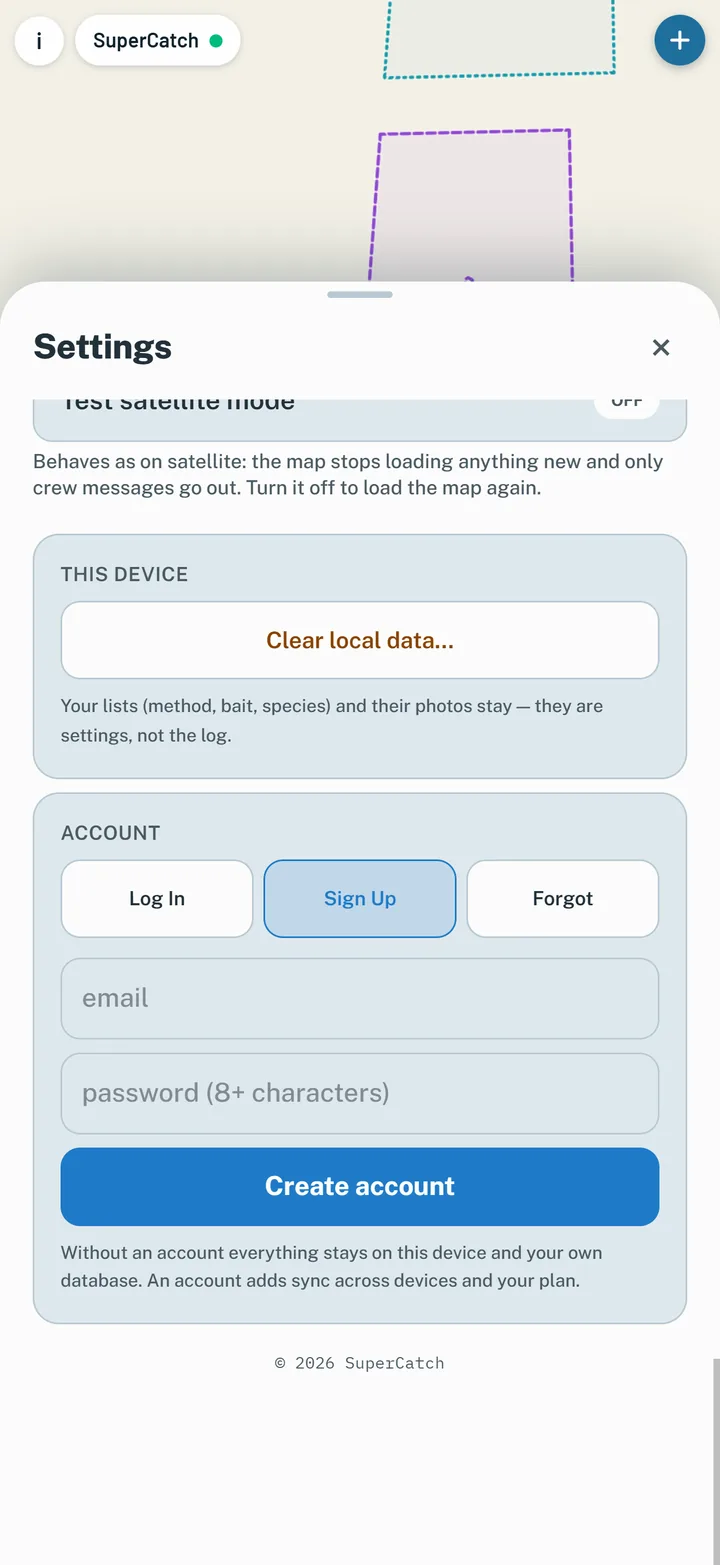
Sign up
Sign up.
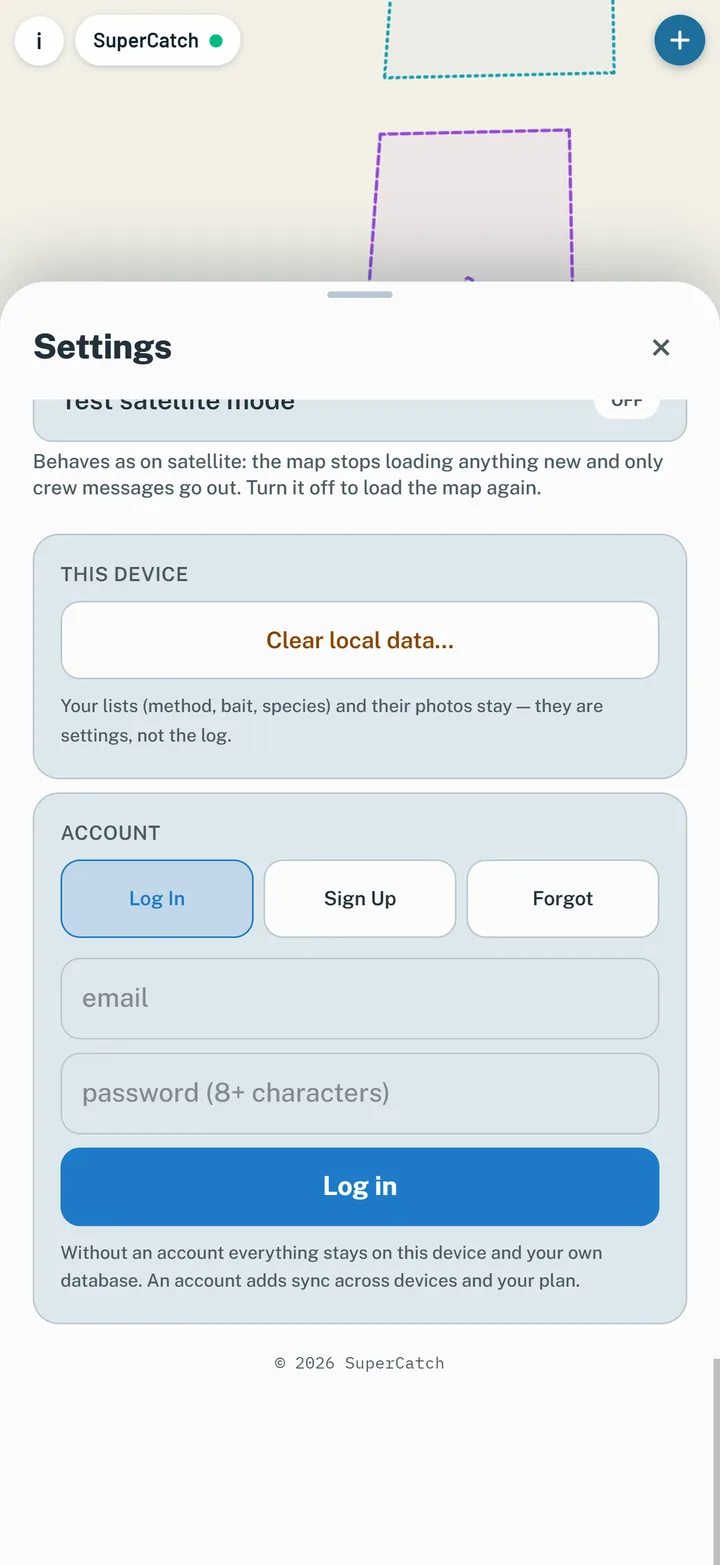
Log in
Log in.
Forgot password
Forgot password.
Confirm your email address
Confirm your email.
Your plan in Settings
Your plan.
A padlocked layer
A padlocked layer.

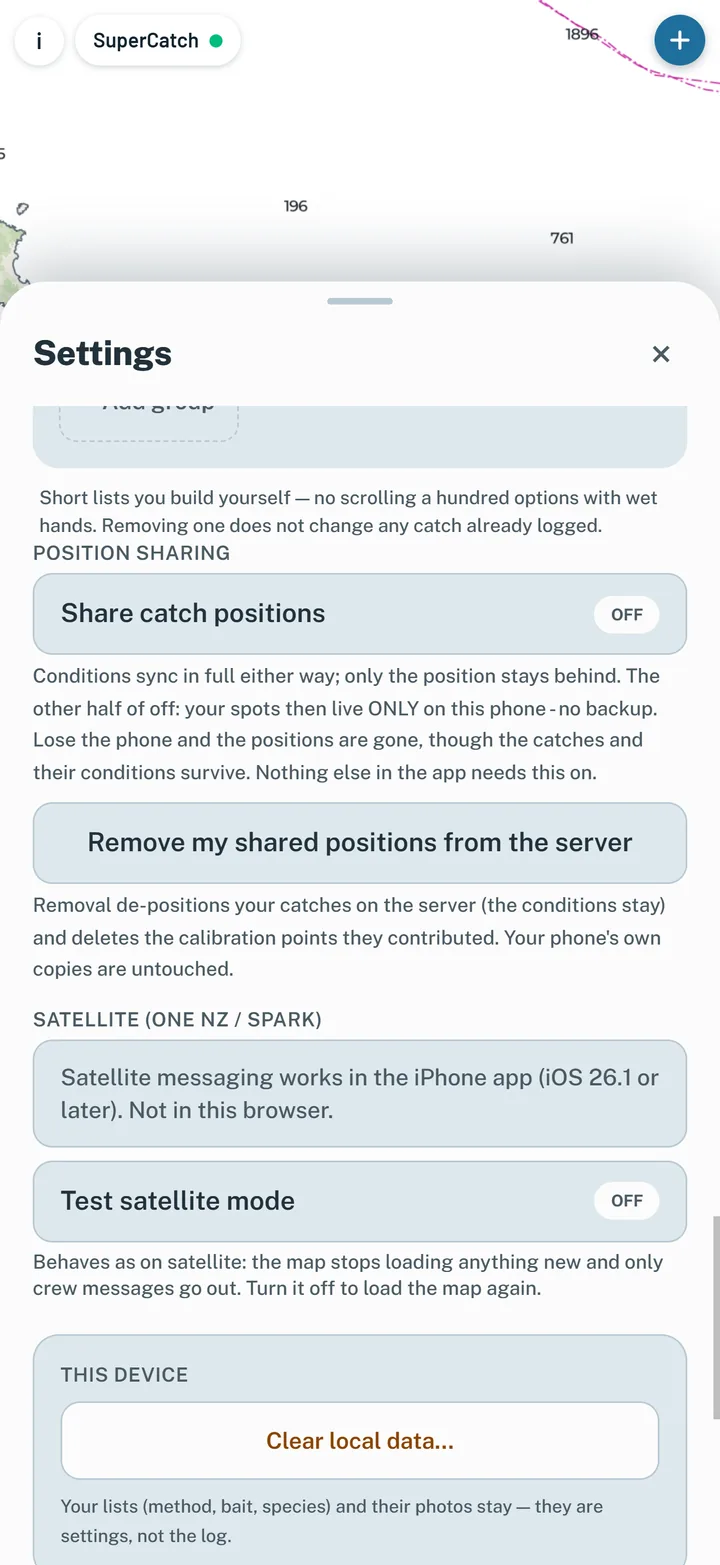
Position sharing - off by default

What you see

One switch in Settings, off until you turn it on. With it off, your catches and their conditions still sync, without coordinates; your spots live on your phone.

How it works

Turning it on applies from that moment forward, never to catches already logged - sharing those is a separate button. Turn it off whenever you like, and a removal action takes every shared position off our server while keeping the conditions. When you tap the map or log a catch, the spot's coordinates ride in the lookup so the server can answer it; those lookups are not stored. Shared positions are used only for SuperCatch's own research, never sold.

The position sharing switch
Position sharing.

Download my data

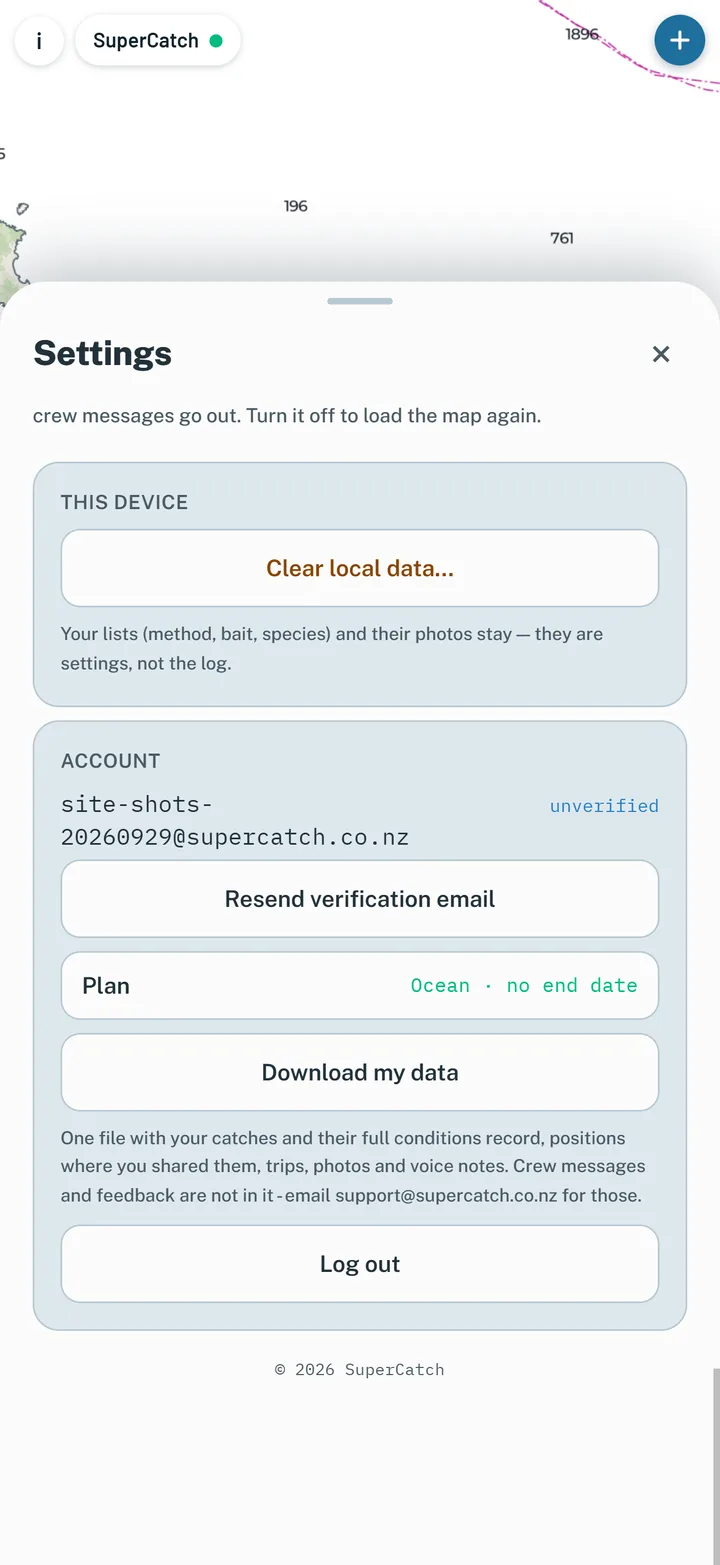
Settings → Account → Download my data gives you one file with your catches and their conditions, the positions you shared, your trips, photos and voice notes. Crew messages and feedback you sent are not in it. The privacy policy has the whole story, including deletion.

Download my data in Settings
One file, everything.

Install it

On iPhone, SuperCatch is an app that needs iOS 26 - an iPhone 11 or newer, or an iPhone SE (2nd generation) or newer. There is no Android app: on Android, open supercatch.co.nz/app in Chrome, tap ⋮, then Install app or Add to Home screen. On a computer it runs in the browser at the same address. In a browser that supports it, Menu → Install app does it in one tap. Updates arrive on their own.

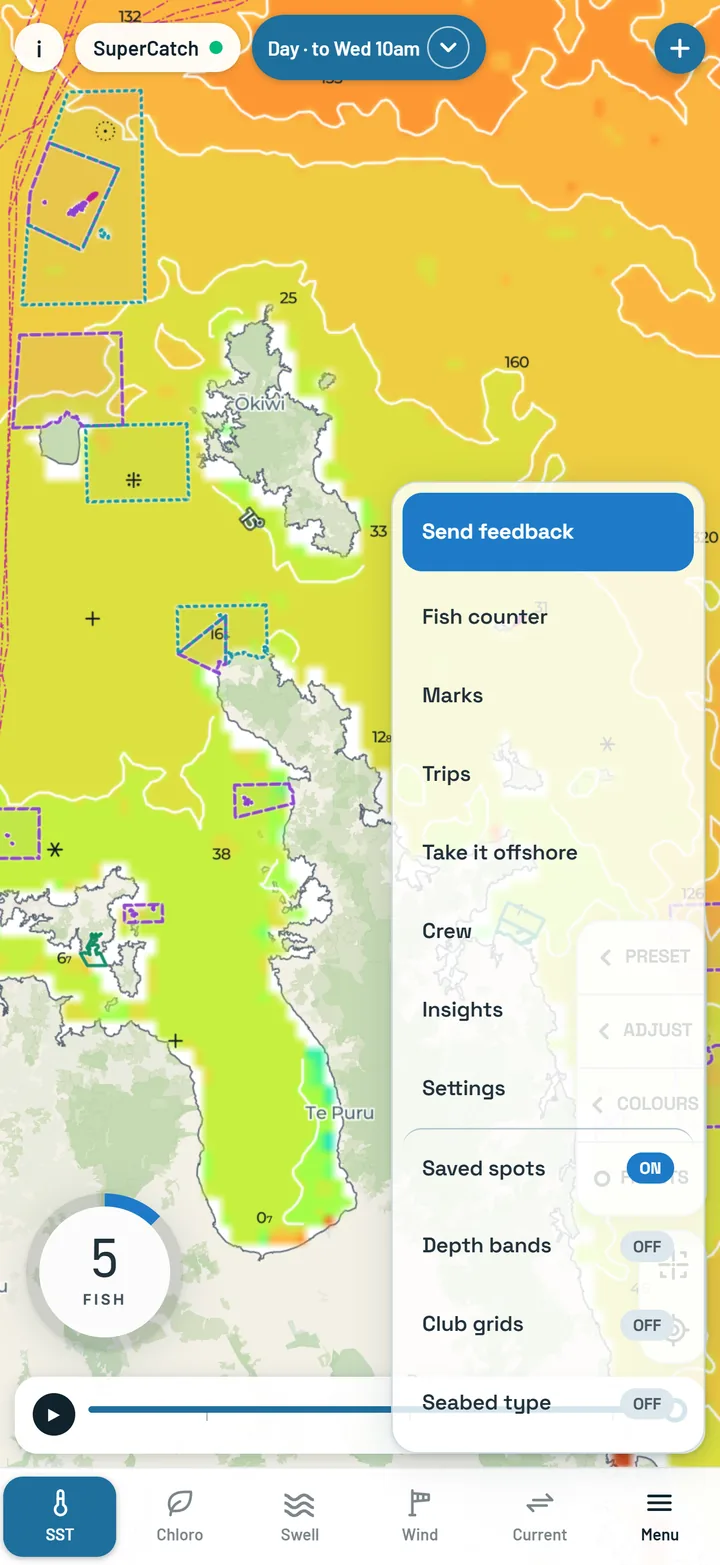
The SuperCatch menu
The menu. In Chrome on Android or a computer, an Install app row appears here too.
The science

Why fronts, and how to read the water well.

Bait gathers where water masses meet, and it has been measured in our own water. Here is the research behind the layers, and what makes a reading worth trusting.

Why the boundaries matter

Lheriau-Nice, Cook and Della Penna (2025) put 836 fishing events and 2,284 aerial sightings of coastal pelagic fish in the Hauraki Gulf and Bay of Plenty significantly closer to ocean colour fronts than chance. Birds and dolphins work those same lines, and every skipper looks for them. Further afield, Xu et al. (2017) found thirty years of Northeast Pacific albacore catch highest on temperature fronts of 0.12 to 0.16 °C per km, and Xing et al. (2026) found that across tropical tuna stocks which side of a front you fish can matter more than the front itself.

On temperature in our own water, tagging put New Zealand striped marlin in water of 20.1 to 24.0 °C three quarters of the time (Sippel et al. 2007), and a larger programme found 21 to 23 °C for most of January and February, rising above 25 °C by April (Sippel, Holdsworth and Saul 2007). Those describe where tagged fish were, over the season - read them with the month attached.

So the app draws the water - fronts, edges and how long they hold - and leaves the fishing judgement where it belongs: with you.

Reading it well

Look for agreementA temperature break on SST Day with a chloro edge on Chloro Day, in the same place for several days, is the strongest picture the app can show.
Step back a dayFronts here move roughly 5 to 15 km a day. A real feature is still near where it was yesterday; a feature that jumped was never water.
Read the seasonThe warm band moves through the year, and the 20 °C water striped marlin favour has been reaching further south since 1990 (Tremblay-Boyer 2021).
Finish with the sounderThe sharpest layers are 2 km for temperature and about 1 km for chloro, and every layer reads the surface. Fish work structure finer than that - four tagged albacore crossed a front over a median 4.2 km (Snyder et al. 2017) - so the app narrows the water down and your sounder finds the spot.
Inshore, use StableThe hourly satellite often has no reading right against the coast, so harbours and enclosed water read from SST Stable. Every Chloro version stops at the edge of the palest chart band, about 30 m, because closer in the seabed and runoff skew the satellite's colour; a tap in shallower water says so.
Every reading has an ageThe mode pill and the card say how old the picture is. Ocean colour needs daylight, so after dark Chloro Live keeps showing the evening's last daylight picture, with its age. Forecasts carry their lead.

When the map is empty

A blank patch is never a zero. Offshore on SST Live, it is cloud - the next hour or SST Day usually fills it. On Chloro Live and Chloro Day, grey means no reading: cloud, or too close to land for a clean reading. Plain light blue water outside the boxes is water SST Live and Day do not cover. A layer that is on but still arriving says so with a badge while it loads, and retries on its own. The app never paints a guess into a hole.

Cloud gaps on the live layer
Cloud.
A layer loading
Still loading.

Why your catch log matters

The two New Zealand studies that put temperature against gamefish catch pull in different directions: Holdsworth, Saul and Browne (2003) found regional abundance, not temperature, explained sixteen seasons of charter catch rate; Francis et al. (2000) found marlin-catching longline sets averaged 21.8 °C against 19.6 °C. A season of catches, each stamped with the water it came from, is exactly the record that settles questions like that - and it is your own seasons, matched to your own water.